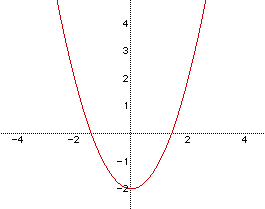
While varying d.
for d=0. We get the following picture.
Now let's look at negative values for d. If we overlay the graphs of
d = -9, -7, -5, -3, -1, we get the following picture.
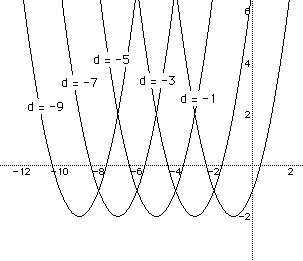
It appears that d is not changing the shape of the graph, but shifting
is along the x axis, and for negative values for d it is shifting the graph
to the left. It appears also that it is shifting the graph so that the minimum
value for x remains -2, and at this point, the value for y=d. Let's look
at the positive values for d and see if we can make any conclusions.
If we set
for d = 9, 7, 5, 3, and 1 we get the following picture.

If you refer back to the picture for negative values of d, you can see
that a similar thing is going on here.
If we set y = 0 for the equation to get
and graph the equation in the xb plane we get the following picture.
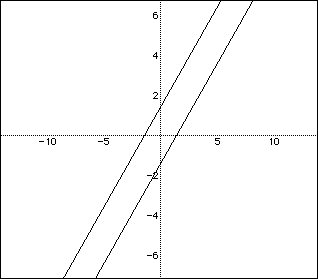
This is what we would expect, since in our graphs above, for each value
of d, the equation
has two roots. So for varying values of d, the graph of the equation
will cross the x-axis for values for x that lie on these two lines.
Now, you might think what if we changed the value -2 to something else.
At the point in which this value is 0, you would have only one root for
x, x=0, For values greater than 0 you would have not roots for x, and for
values less than 0 you will always get 2 roots. Again, if you change this
value, you are only changing the position of the graph, not the shape.
What if you were to change the degree of the equation? What would happen
to the shape of the graph?