Graphing equations is an improtant concept for Algebra 1. It is an essential skill in itself, but also enriches other concepts included in this course. The use of computer software should remove much of the time consuming and tedious calculation, so that the students can see many examples illustrated. I have included some examples, with only one or two equations each, but they are easily changed and adapted to illustrate the concept being investigated.
The use of a spreadsheet with its graphing capabilities is applicable to the eight grade Algebra 1 class that I will be teaching. Most of the students should be able to try these on home computers or hand-held graphing calculators.
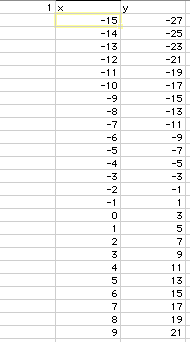
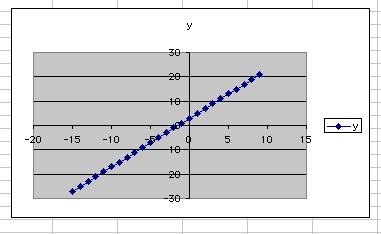
The first step is to have them enter values for x and y on the spreadsheet. This may include instruction of how to auto-fill cells and how to enter formulas. The following example has the increments for x, in column B, in cell A1, and the y values calculated for that x in column C. In the spreadsheet and accompanying graph, it is easy for students to see the what changes in slope or y-intercept will do to the graph of the linear equation. This particular equation is y=2x+3, but is easily changed to any other value of m or b.

The graph associated with this table was also constructed by the spreadsheet software. Students will need to be directed to find how to get the software to construct this graph.

Another helpful software is Graphing Calculator. With it students can see the movement of the vertex of a parabola with a simple quadratic equation where a and n can be varied and animated.

The Graphing Calculator can also illustrate solving systems of equations. In Algebra 1, students solve simultaneous equations with substitution, addition, or graphically. If done graphically with software, students can change parameters so that they can see where the lines are parallel giving no solution, where they coincide giving infinitely many solutions, and where they intersect giving one solution. The following concepts of solving a system of equations by substitution and addition should be better understood after experiences with graphic solutions.

Another example of graphing software extending the exploration is in solving a nonlinear system of equations. As with the previous example many aspects of the equations can be varied so that students can develop a deeper understanding of possible solutions.

The value of these demonstrations in an Algebra 1 class can be considered in terms of motivation and deeper understanding.