A Microsoft Excel file was used to see the iteration of a seeded point (x(0), y(0)) by the sequences x(n+1) = 1 - y(n) + abs(x(n)) and y(n+1) = x(n). The point was iterated 500 times and then plotted in an XY scatterplot. This paper will explore the iteration of various points (x, y) by seeding the initial values of x in cell A1 and the initial value of y in cell B1. Because we did not know where exactly to start, we are also going to explain how we attempted to examine the problem and what patterns we looked for and tried to explain.
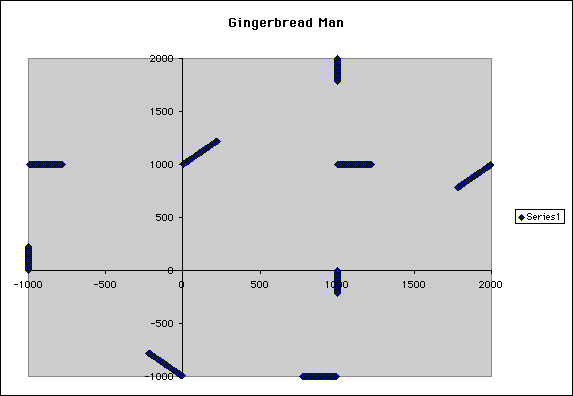
Our first goal was to examine the various patterns that occured when we inserted random values for A1 and B1. We started out by using a large value for A1 and a small value for B1. We used A1 = 1000, and B1 = 0.1. The results were as follows (example 1):

We then wanted to see if the scatterplot would change at all if we kept A1 = 1000, but used a large number for B1 such as 100. The results were as follows (example 2):
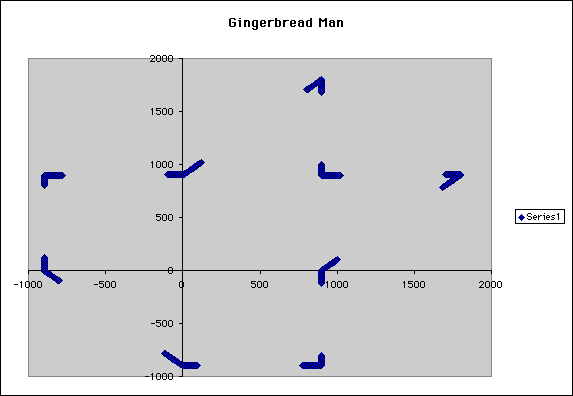
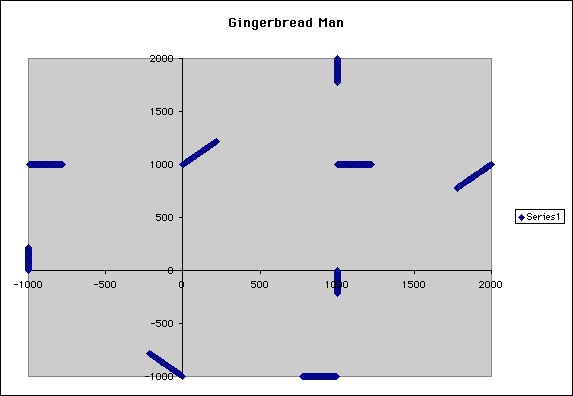
It looked as if the lines that were graphed before were now "bent". We then wondered if the reversal of the ordered pairs would give us the same results. We tried A1 = 0.1 and B2 = 1000. The graph did not look the same. Therefore, we attempted to see what value we could use for A1 that would produce the same graph as example 1. We found that by using 1 for A1 and 1000 for B2. (example 3)
Our next exploration was to try using some small values for A1 and B1 to see some different graphs. We first tried A1 = 0.1 and B1 = 2. The picture, example 4, appeared to resemble the gingerbread man we were looking for.
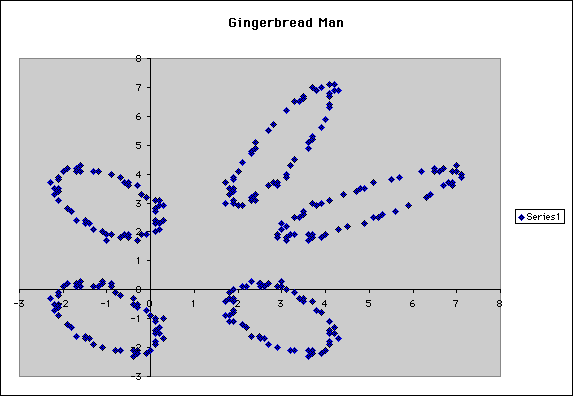
We thought another pair of small values for A1 and B1 would definitely produce a gingerbread man. However, when we tried A1 = 1.3 and B1 = 0.1, we got something much different. (example 5)
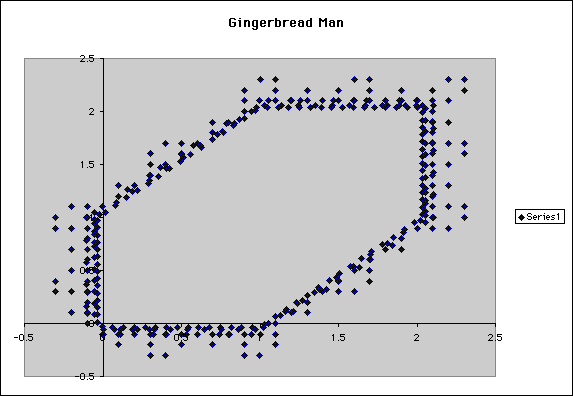
We felt as if we had lost the gingerbread man and only produced the first one by luck. Therefore, we tried A1 = 2 and B1 = 0.99. This picture resembled the previous example, however there were no points hovering around the line. Instead the points created a closed figure, a hexagon.
We became extremely frustrated in our search for the infamous gingerbread man. Could there be a pattern that would lead us to him. We tried using a number and half of that number for the second point. We tried A1 = 5 and B1 = 2.5. We saw what resembled a faint outline of a gingerbread man, but we did not like the results. We tried A1 = 5 but used B1 = 2.49 and we were shocked when we saw what looked to be the head, arms, and legs of our gingerbread man. (example 6)
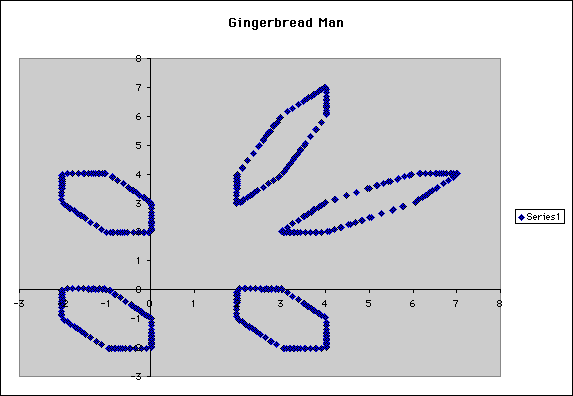
We thought we were headed in the right direction. Thus, we tried A1 = 5 and B1 = 2.05. The results were incredible. We could actually see what appeared to be the gingerbread man we were looking for! (example 7)
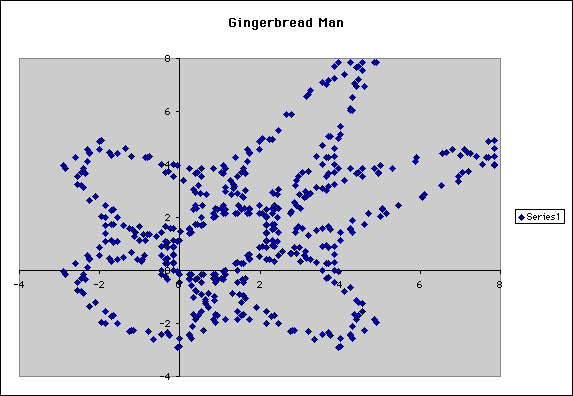
Now, we were on a mission to find other gingerbread men. We knew that could not be the only one. Our next guess was to look for another pattern. We next tried a number and its inverse to see if the results would lead to a picture of a gingerbread man. We used A1 = 2 and B1 = 0.5. (example 8)
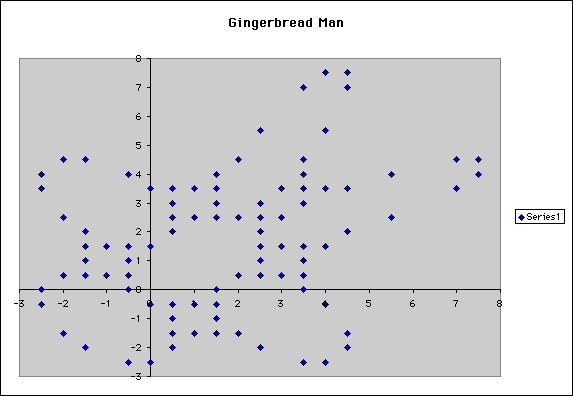
We could faintly see the outline of our gingerbread man! That made us feel as if we were in the right direction again. We then tried other numbers that were close to 2 and close to 0.5, but we could not get what was considered to be a gingerbread man. As we lowered our first value and last value, we tried A1 = 1.31 and B1 = 0.01. (example 9)
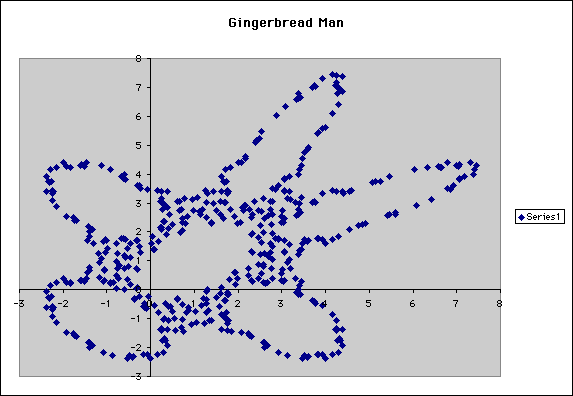
There was another gingerbread man!
Our next challenge was to see how many ways we could create a gingerbread man if we used a negative value for either A1 or B1 or both. We saw our gingerbread man when we used A1 = 4.51 and B1 = -1.5. We also saw the head, arms, and legs of the gingerbread man when we used A1 = 4.1 and B1 = -1.5. We then tried to get the gingerbread man when our first value, A1, was negative. We tried the opposite of our original findings in example 10 and example 11. Since the opposite values did not create a gingerbread man, we tried working from there and found when we used A1 = -0.5 and B1 = 4.1, we saw our little man again!
In conclusion, one can see that the exploration of the gingerbread problem was exiting and entertaining. We realized that half of the fun was not finding the gingerbread man, but finding some really beautiful patterns. We saw some unusual graphs that were created that could lead to some further investigations. We discussed the endless possibilities an activity such as this one would have for our high school students. An activity like this encourages students to not look for one solution, but for many solutions as problem solvers.