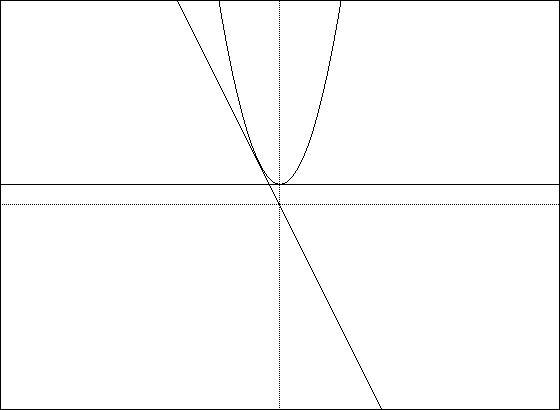

Another example would be f(x) = 2[[radical]]x. Here, the slope at any
point (x,f(x)) on the graph of f is given by f'(x) = 1/[[radical]]x. Thus,
at the point (1,2), the slope is f'(1) = 1. However, at the point (0,0)
the slope is undefined, since substituting x = 0 in f'(x) produces division
by zero.
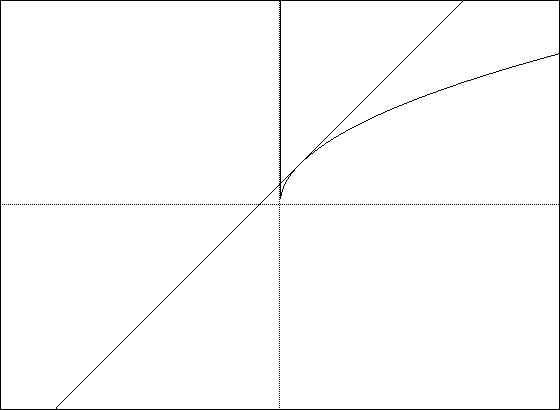
The graph below shows the graph of f(x) and the tangent line at (1,2).
Now let's look at second derivatives. For a function whose second derivative
exists on an open interval I, we can test for concavity. If f''(x) >
0 for all x in I, the graph of the function is concave upward. If f''(x)
< 0 for all x in I, the graph of the function is concave downward.
For example, let f(x) = (x2-1)/(x2-4). Then f'(x) = -6x/(x2-4)2, and f''(x)
= 6(3x2+4)/(x2-4)3. The second derivative, f''(x), is discontinous at x
= 2 and x = -2. Thus, the concavity can be tested in the intervals (-inf,
-2), (-2, 2), and (2, inf). The interval (-2, 2) is the only interval which
will produce negative values for the second derivative. Thus, the graph
will be concave downward in the interval (-2, 2). The other two intervals
produce positive values for the second derivative. Thus, the graph will
be concave upward in those intervals.
The values for the second derivative are as follows:
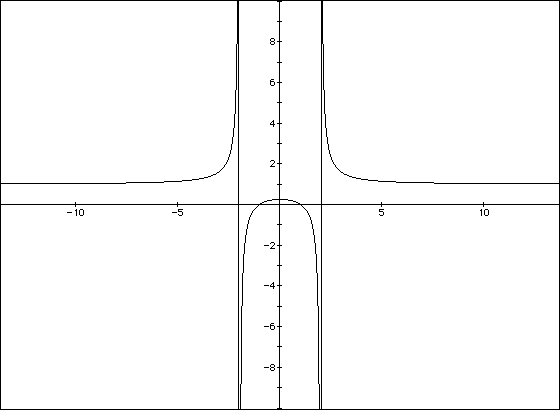
Now let's graph f(x) to show that the graph is indeed concave upwards on (-inf, -2) and (2, inf), but concave downwards on (-2, 2). The vertical linesx-values f''(x) values -10 0.00206 -9 0.00325 -8 0.00544 -7 0.00994 -6 0.02051 -5 0.05118 -4 0.18056 -3 1.48800 -2 #DIV/0! -1 -1.55556 0 -0.37500 1 -1.55556 2 #DIV/0! 3 1.48800 4 0.18056 5 0.05118 6 0.02051 7 0.00994 8 0.00544 9 0.00325 10 0.00206
    x-values      f'(x) values
      -5.0        -105.00
      -4.5         -87.75
      -4.0         -72.00
      -3.5         -57.75
      -3.0         -45.00
      -2.5         -33.75
      -2.0         -24.00
      -1.5         -15.75
      -1.0          -9.00
      -0.5          -3.75
         0.0           0.00
         0.5           2.25
         1.0           3.00
         1.5           2.25
         2.0           0.00
        2.5          -3.75
        3.0          -9.00
       3.5         -15.75
       4.0         -24.00
       4.5         -33.75
       5.0         -45.00

The above graph shows the x-values versus the first derivative values.
Notice that f'(x) is positive between x=0 and x=2, showing that the actual
graph of f(x) is increasing on that interval. Let's compare this graph with
a graph a the original function f(x).
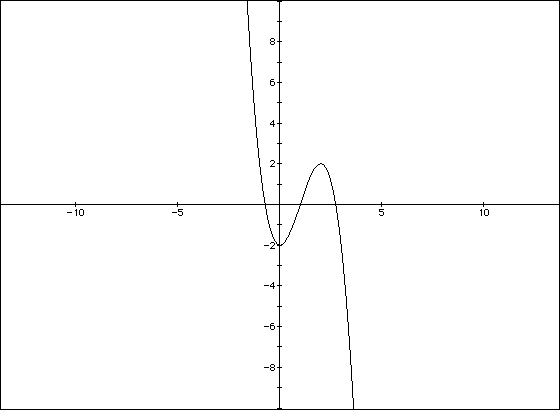
This graph seems to be increasing on (0, 2).
Let's look at one final example. Let f(x)=2x/(x2-x+1).
Then f'(x) = (-2x2+2)/(x2-x+1)2 , and f"(x) = [-4x(x2-x+1) -(4x-2)(-2x2+2)]/(x2-x+1)3.
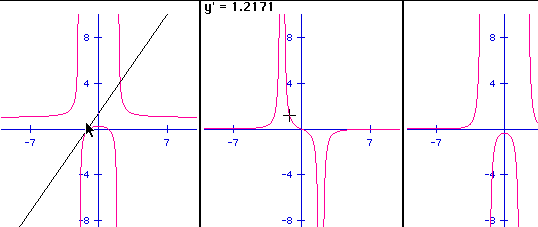
Let's use Algebra Xpresser to graph f(x), f'(x), and f"(x) all on the
same axis.
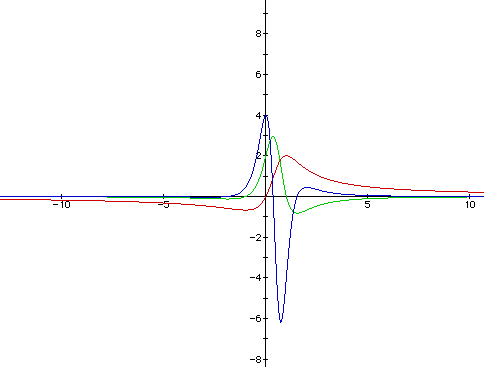
The red graph is of f(x), the green graph is f'(x), and the blue graph
is f"(x). Let's compare the red graph with the green graph. When f'(x)
is positive (that is, the green graph is above the x-axis), then the red
graph, f(x), is increasing. The critical numbers are x=1 and x=-1 since
f'(1)=0 and f'(-1)=0. The green graph is neither positive or negative at
these values, so f(x) is neither increasing nor decreasing there. The slope
of the tangents at the points (1, f(1)) and (-1, f(-1)) is zero, so f(1)
is a relative maximum, and f(-1) is a relative minimum. That is, (-1,-2/3)
is a relative minimum, and (1,2) is a relative maximum.
Informally, we can think of a relative maximum occuring on a "hill"
on a graph and of a relative minimum occuring on a "valley". If
the hill (or valley) is smooth and rounded, then the graph has a horizontal
tangent line at the high point (or low point). On the other hand, if the
hill (or valley) is sharp and) peaked, then the graph represents a function
that is not differentiable at the high point (or low point). The hill and
valley in the above (red) graph is smooth and rounded.
Now let's compare the blue, f"(x), graph with the red, f(x) graph.
When f"(x) is positive (i.e. the blue graph is above the x-axis) then
the red graph is concave upwards. And when f"(x) is negative, then
the red graph is concave downwards. The points of inflection (points where
the concavity changes) of the graph of f(x) occur when f"(x)=0 or f"(x)
is undefined. Thus, when the blue graph crosses the x-axis, the red graph
will change concavity.
In conclusion, the first and second derivatives of a function can tell us
a lot about the graph of the function. From this essay, I have reinforced
my knowledge of this subject. I have looked at derivatives in ways I had
not before, and I was better able to actually see what was happening. I
was also able to experiment with software I had not used before (namely,
xFunctions ).