Set-up of the AM-GM Analysis
On the right --
The blue graph shows the function
.
The purple graph shows the distance function.
The red graph shows the minimum value of the distance function, a constant line tangent to the curve.
The green vertical graph shows the value of x where a minimum is reached.
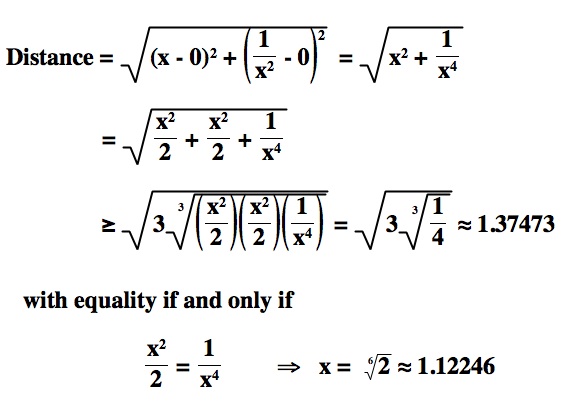
The distance function.
Need to have factors of the variable with product that is a constant.
Apply the AM-GM inequality for 3 positive numbers.
Determine where the mininimum distance occurs.