Alex Szatkowski
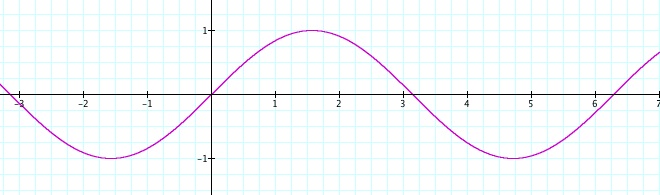
The following exploration will look at the possible graph transformations for the graph of the Sine Function.
In order to recognize these transformations, we must first be familiar to the parent function, and the characteristics of its graph.

I can now easily identify the following characteristics:
Domain: All Real Numbers
Range: ![]()
Period: 2Π
X-intecepts: (0,0) and multiples of Π.
Y-intercepts: (0,0)
Maximum points: every other odd multiple of ![]() beginning with
beginning with ![]()
Minimum points: every other odd multiple of ![]() beginning with
beginning with ![]()
Now that we have established the characteristics of the parent function of sine and the common mathematical terms, we can investigate transformations of the graph.
This is a task I would present to an Accelerated Math III class.
The standard form of the sine function is y = Asin (bx+c) + d
Where A,b,c, and d are parameters(A) Make predictions of what the graph will look like for the following functions:
1. a) y = 10 sin (x) b) y = -10 sin (x)
2. a) y = sin (10x) b) y = sin (-10x)
3. a) y = sin (x -10) b) y = sin (x + 10)
4. a) y = sin (x) + 10 b) y = sin (x) - 10
(B) Using your graphing calculator sketch from x = -2Π to x = 2Π the graphs:1. y = 10 sin (x)
3. y = sin (x - 10)
2. y = sin (10x)4. y = sin (x) + 10
(C) What do you notice compared to the parent function y = sin (x)1.
2.
3.
4.
(D) Using your graphing calculator sketch from x = -2Π to x = 2Π the graphs:
1. y = -10 sin (x)
3.y = sin (x +10)
2. y = sin (-10x)4. y = sin (x) - 10
(E) What do you notice for each compared to the parent function y = sin (x)1.
2.
3.
4.
(F) What, if any of your predictions were correct?
(G) Make a conjecture detailing the transformations of the graph of the sine function when:
1. a ≠ 1
2. b ≠ 1
3. c ≠ 0
4. d ≠ 0
(H) Pick three values besides 0,1,10 or -10 to test you conjecture
(I) Did your conjectures hold true for your 3 new values?
(J) A,b,c,d are all parameters that have an affect on the graph of y= sin (x).
1. A is the amplitude of the graph. In the parent function, A=1. Amplitude is half of the distance from the maximum to the minimum. Since amplitude measures distance, it cannot be negative and therefore the amplitude of a sine graph is |A|.
a. What are the max and min points for a sine graph with A = 5?
b. What are the max and min points for a sine graph with A = -4?
2. b, is used to find the period of the function. The period of a function is the time it takes for one complete revolution to occur. In y= sin (x), the graph began repeating itself after 2Π. The period of a function is found by
a. What is the period for y= sin (2x)?
b. What is the period for y= sin (
x)?
3. c, is used to find the horizontal shift, or phase shift. The phase shift is defined as
.
a. What is the phase shift for
?
b. What is the phase shift for
?
4. d represents the vertical transformation. When d > 0 the graph translates vertically up, while when d < 0 the graph translates vertically down.
a. What is the vertical tranformation for y = sin (x) -4
b. What is the vertical transformation for y = sin (3x) + 11
5. When y = sin (x) is tranformed vertically, the line equidistant to the max and the min points is called the midline. What happens to the midline when the function is translated up or down?
Summary:
Parameter |
Effect |
Example |
A
|
|
|
b
|
|
|
c
|
|
|
d
|
|
|
Make the following predictions:
What if we changed both a and b? a and c? a and d?
Will changing one parameter affect the other? All, or just certain ones?
Graph using a graphing calculator:
y = -4 sin (-4x) y = -3 sin (x-3) y = -2 sin (x) -2
What were the results?
To summarize further:
1. Describe the transformations of the graph of y = 2 sin (3x+Π) -10.
2. Describe the transformations of the graph of
.
Answer Key for Task
The standard form of the sine function is y = Asin (bx+c) + d
Where A,b,c, and d are parameters(A) Make predictions of what the graph will look like for the following functions:
1. a) y = 10 sin (x) b) y = -10 sin (x)
2. a) y = sin (10x) b) y = sin (-10x)
3. a) y = sin (x -10) b) y = sin (x + 10)
4. a) y = sin (x) + 10 b) y = sin (x) - 10
(B) Using your graphing calculator sketch from x = -2Π to x = 2Π the graphs:1. y = 10 sin (x)
2. y = sin (10x)
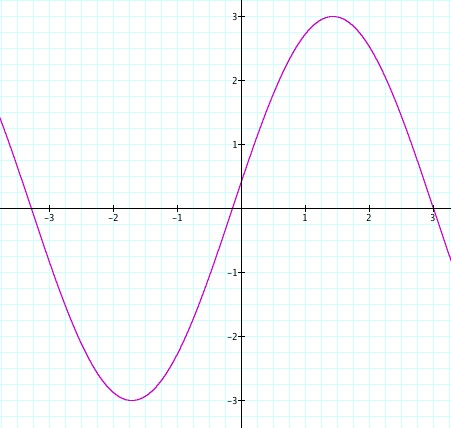
(C) What do you notice compared to the parent function y = sin (x)1. The max and min values have been stretched from 1 and -1 to 10 and -10 respectively (amplitude)
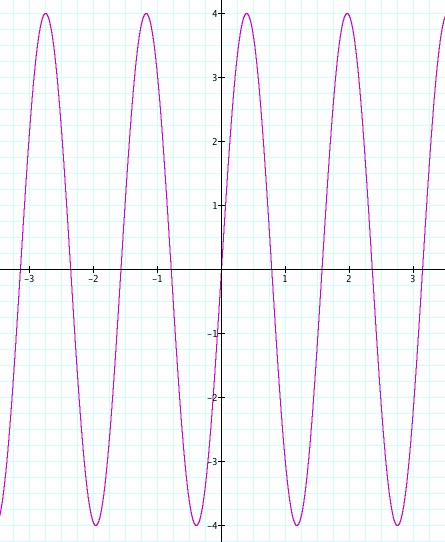
2. The sine curve repeats itself in a shorter amount of time (period)
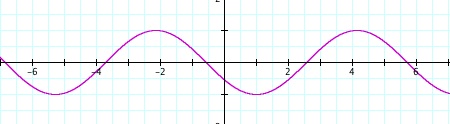
3. The sine curve has been transformed horizontally to the right (phase shift)
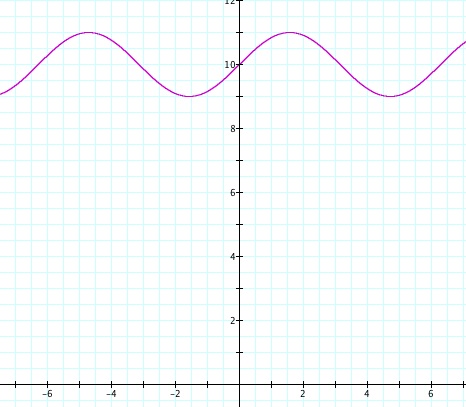
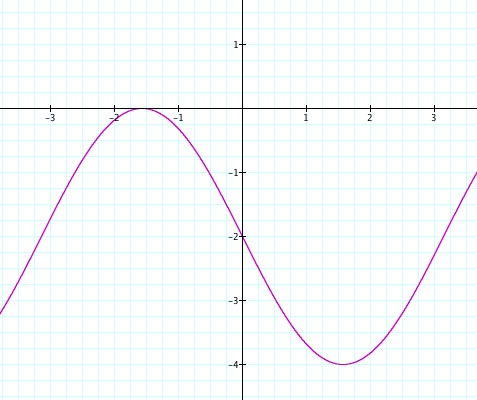
4. The sine curve has been moved up 10 (vertical translation)
(D) Using your graphing calculator sketch from x = -2Π to x = 2Π the graphs:
1. y = -10 sin (x)
2. y = sin (-10x)
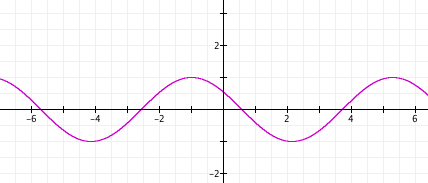
(E) What do you notice for each compared to the parent function y = sin (x)1. The max and min values have been stretched from 1 and -1 to 10 and -10 respectively (amplitude), and the graph has been reflected over the x-axis
2. The sine curve repeats itself in a shorter amount of time (period), and the graph has been reflected over the x-axis
3. The sine curve has been transformed horizontally to the left (phase shift)
4. The sine curve has been moved up 10 (vertical translation)
(F) What, if any of your predictions were correct?Hopefully students will recall previous knowledge of other trasnformations of functions such as linear and quadratic functions. Students' predictions may be accurate in what the graph will look like visually, however, as they will discover over the task, those same transformations we have studied before mean different things for the sine function, as well as other trigonometric functions.
(G) Make a conjecture detailing the transformations of the graph of the sine function when:
1. a ≠ 1 When a > 1. the graph is stretched vertically. The max and min values are further apart. When a < 1, the graph is shrunk vertically. The max and min values are closer together.
2. b ≠ 1 When b > 1 the time it takes for one revolution to occur is smaller then 2Π and when b < 1 the time is takes for one revolution to occur is larger 2Π
3. c ≠ 0 When c is anything but 0, the graph will experience a horizontal translation.
4. d ≠ 0 When d > 0 the graph will be translated vertically up. When d < 0 the graph will be translated vertically down.
(H) Pick three values besides 0,1,10 or -10 to test you conjectureStudent may choose any number and have similar observations of the transformations.
(I) Did your conjectures hold true for your 3 new values?They should hold true for any value.
(J) A,b,c,d are all parameters that have an affect on the graph of y= sin (x).
1. A is the amplitude of the graph. In the parent function, A=1. Amplitude is half of the distance from the maximum to the minimum. Since amplitude measures distance, it cannot be negative and therefore the amplitude of a sine graph is |A|.
a. What are the max and min points for a sine graph with A = 5? Max= 5 Min= -5
b. What are the max and min points for a sine graph with A = -4? Max= 4 Min= -4
2. b, is used to find the period of the function. The period of a function is the time it takes for one complete revolution to occur. In y= sin (x), the graph began repeating itself after 2Π. The period of a function is found by
a. What is the period for y= sin (2x)? Period = Π
b. What is the period for y= sin (
3. c, is used to find the horizontal shift, or phase shift. The phase shift is defined as
a. What is the phase shift for
b. What is the phase shift for
4. d represents the vertical transformation. When d > 0 the graph translates vertically up, while when d < 0 the graph translates vertically down.
a. What is the vertical tranformation for y = sin (x) -4? Vertical: 4 down
b. What is the vertical transformation for y = sin (3x) + 11? Vertical: 11 up
5. When y = sin (x) is tranformed vertically, the line equidistant to the max and the min points is called the midline. What happens to the midline when the function is translated up or down?
The vertical translation determines the midline. When d = 0 the midline is at y = 0, or the x-axis. When the function has a vertical translation, the midline moves up or down depending on the translation.
Summary:
Parameter Effect
Example
A: amplitude
either increases or decreases distance between min and max (range)
|A|= Amplitude
y = 4 sin (x)
Amplitude = |4| = 4
b: used to find Period
when b >1 the period is less than 2Π, when b < 1 the period is greater than 2Π.
= Period
y = cos (3x)
Period =
c: used to find phase shift
Horizontal transformation right or left.
y = sin (2x - Π)
Phase shift =
d: Vertical Translation
When d > 0 the graph is translated vertically up. When d < 0 the graph is translated vertically down.
y= cos (x) -17
Vertical shift: 17 down
Make the following predictions:
What if both a and b weren't 1 or 0? a and c? a and d?
1. The function would have a different amplitude and the period would not be 2Π.
2. The function would have a different amplitude and have a horizontal or phase shift.
3. The function would have a different amplitude and a vertical translation, so the midline would not be at y = 0 (x-axis)
Will changing one parameter affect the other? All, or just certain ones?
The only transformation that is affected by the other parameters is phase shift. Because the phase shift depends on both c and b, even without changing c, if b is changed, the phase shift will be different as well.
Graph using a graphing calculator:
y = -4 sin (-4x) y = -3 sin (x-3) y = -2 sin (x) -2
What were the results?
The transformations we anticipated occurred.
To summarize further:
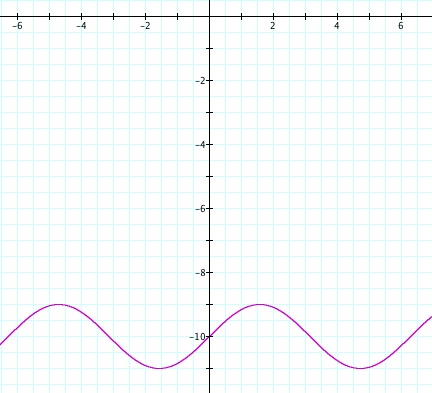
1. Describe the transformations of the graph of y = 2 sin (3x+Π) -10.
The sine function will have an amplitude of 2.
The period will be
.
There is a
phase shift to the left.
Finally, the midline can be found at y = -10.
Other information we can deduce:
The max will be at -8 and the min will be at -12.
2. Describe the transformations of the graph of
The cosine function will have an amplitude of 6.
There will be a reflection across the x-axis.
The period will be 6Π.
There is a 8Π phase shift to the right.
Finally, the midline can be found at y = 1.
Other information we can deduce:
The max will be at 7 and the min will be at -5.