The premise: Let f(x) = a sin(bx + c) and g(x) = a cos(bx + c).
For selected values of a, b, and c, graph and explore
i. the sum of f and g, h(x) = f(x) + g(x)
ii. the product of f and g, h(x) = f(x)g(x)
iii. the quotient of f and g, h(x) = f(x)/g(x)
iv. the composition of f with g, h(x) = f(g(x))
Return to the Write-Ups on Amy's Class Page
To begin this exploration, let a = b = 1 and c = p/4. In the image below, the purple graph is f(x) = sin(x + p/4); the red graph is g(x) = cos(x + p/4); the blue graph is h = f + g.
h appears to be a cosine graph with amplitude larger than f and g. In fact, the amplitude of h is sqrt(2), since the maximum point of h will occur when the y-values of the sine and cosine graphs are equal, i.e., when sine and cosine both yield sqrt(2)/2. [sqrt(2)/2 + sqrt(2)/2 = sqrt(2).] Note that the maximum occurs at x = 0 because I chose c to be p/4, a very convenient choice for beginning this investigation!
Vary a: Now, keeping b and c constant, vary a. In the graphs below, a varies from 0.5 (green graph) to 1 (purple) to 2 (red) to 3 (blue.)
As would be expected, varying a changes the amplitude of the resulting cosine graph. In fact, the amplitude of these sums of f and g is always asqrt(2), which makes sense because all these graphs are simply the result of a vertical stretching or shrinking. So the equations for these graphs are equivalent to h(x) = asqrt(2)cos(x).
Vary b: Next, keep a = 1, c = p/4, and vary b. In the graphs below, b varies from 0.5 (green graph) to 1 (purple) to 2 (red) to 3 (blue.)
As would be expected, varying b varies the period of the resulting cosine graph. All these graphs are the result of a horizontal shrinking or stretching. So, these graphs of the sums of f and g have the same period as the respective graphs of f and g. That is, the equations for these graphs are equivalent to h(x) = sqrt(2)cos(bx).
Vary c: Finally, keep a = b = 1 and let c vary. In the graphs below, c varies from p/2 (green graph) to 3p/8 (blue) to p/4 (purple) to p/8 (red).
It is no surprise that varying c affects the phase (horizontal) shift of the graph, but it's not so immediately obvious how the graph is shifting. One way to think about it is to determine what x-value will now yield p/4 as an argument for sine or cosine, since that x-value will then produce the maximum on the graph of the sum of f and g. In general terms, for any given c, p/4 will occur as an argument when x + c = p/4 or x = p/4 - c. So the equations for these graphs are equivalent to h(x) = sqrt(2)cos(x - (p/4 - c)).
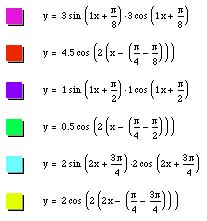
Now, put it all together! Below are graphs with varying values for a, b, and c. The equations are listed to the right.
 |
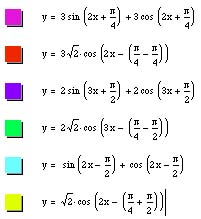 |
So, if f(x) = a sin(bx + c) and g(x) = a cos(bx + c), then the sum of f and g is equivalent to h(x) = asqrt(2)cos(bx - (p/4 - c)).
To see an algebraic proof, click here.
Return to the Write-Ups on Amy's Class Page
To begin this exploration, again let a = b = 1 and c = p/4. In the image below, the purple graph is f(x) = sin(x + p/4); the red graph is g(x) = cos(x + p/4); the blue graph is h = f g.
The result is a cosine graph with amplitude 1/2, since again the maximum point of h will occur when the y-values of the sine and cosine graphs are equal, i.e., when sine and cosine both yield sqrt(2)/2. [sqrt(2)/2 * sqrt(2)/2 = 1/2.] The period of the graph is p, which means an equivalent equation for this product of f and g is h(x) = 1/2 cos(2x).
Vary a: Now, keeping b and c constant, vary a. In the graphs below, a varies from 0.5 (green graph) to 1 (purple) to 2 (red) to 3 (blue.)
Again, a affects the amplitude of the graph because it stretches or shrinks f and g vertically. Since the values of sine and cosine at p/4 will always be asqrt(2)/2, their product (and the amplitude of h) will be a^2/2. Thus the equations for these graphs are equivalent to h(x) = a^2/2 cos(2x).
Vary b: Next, with a = 1 and c = p/4, vary b. In the graphs below, b varies from 0.25 (blue graph) to 0.5 (green) to 1 (purple) to 2 (red.)
It is no surprise that varying b varies the period of the graph, since it produces a horizontal stretch or shrink. When b = 1, the period of h is p; when b = 2, the period of h is p/2; when b = 3, the period of h = p/3. So, I conjecture that the equations for these graphs are equivalent to h(x) = 1/2 cos(2bx).
Vary c: Finally, keep a = b = 1 and let c vary. In the graphs below, c varies from p/2 (blue graph) to 3p/8 (green) to p/4 (purple) to p/8 (red).
Again, the phase shift of the graph is affected. To analyze the situation, consider that we are still interested in what value of x produces p/4 as an argument for sine and cosine. That is, the argument of sine or cosine will be p/4 when x = p/4 - c. So, these graphs are equvalent to h(x) = 1/2 cos(2(x - (p/4 - c))). While this way of writing the equation is somewhat cumbersome, it allows for the identification of the various effects of changing a, b, and c.
Now...view some examples below, where a, b, and c vary.
 |
 |
I conjecture that if f(x) = a sin(bx + c) and g(x) = a cos(bx + c), then the product of f and g is equivalent to h(x) = a^2/2 cos(2(bx - (p/4 - c))).
To see an algebraic proof, click here.
Return to the Write-Ups on Amy's Class Page
The exploration of this combination of f and g is a little more obvious than the other two because, to put it simply, sin(dinosaur)/cosine(dinosaur) = tangent(dinosaur).
Notice that when we take the quotient of f and g, the values of a "cancel out" and do not influence the resulting function h. Therefore, if f(x) = a sin(bx + c) and g(x) = a cos(bx + c), then the quotient, f ÷ g is equivalent to h(x) = tan(bx + c) or h(x) = tan(b(x + c/b)). To illustrate this result, view some examples below where b and c vary.
 |
In the purple graph, b = 1 and c = p/4, so its period is p and the phase shift is -p/4. In the blue graph, b = 2 and c = p/4, so its period is p/2 and the phase shift is -p/8. |
 |
In the red graph, b = 0.5 and c = p, so its period is 2p and the phase shift is -2p. (Which means, of course, that it appears to have no phase shift.) In the green graph, b = 3 and c = p/8, so its period is p/3 and the phase shift is -p/24, a very small negative shift! |
As you can see, b still affects the period of the tangent graph, and these graphs all have periods of p/b. The phase shift of the graphs is -c/b.
Return to the Write-Ups on Amy's Class Page
Now, this part of the exploration is where the really cool stuff begins. Again let a = b = 1 and c = p/4. In the image below, the purple graph is f(x) = sin(x + p/4); the red graph is g(x) = cos(x + p/4); the blue graph is h(x) = f(g(x)).
Obviously, the composition is no simple cosine graph!
Vary a: Keeping b and c constant, vary a. See a movie of how h changes with varying values of a. When you finish viewing the movie, press the Back button to return to this page.
Wow! On the graph, n = a ranges from 1 to 8. Notice that the maximum and minimum values of the graph when n = 8 appear to be, respectively 8 and -8. Obviously, changing a still affects the vertical stretch of the graph, but it also appears to affect the number and direction of the "dips" in the graph, and the horizontal compression of the graph within the viewing frame. (Of course, vertical stretching can give the impression of horizontal compression.) On the same window, for smaller values of a the graph appears more "spread out," while for larger values of a the graph appears more compressed. Also, as a increases, there appear to be more dips--i.e., more maximum and minimum points.
Vary b: Next, with a = 1 and c = p/4, vary b. See a movie of how h changes with varying values of b. When you finish viewing the movie, press the Back button to return to this page.
With the sliding values of n = b (from 1 to 4), the horizontal compression as b increases can be seen very clearly. As b increases, the graph becomes very compressed with the dips appearing more numerous and pronounced. As b decreases, the graph appears to smooth and spread out. Interestingly, at b = 1, the maximum appears to be about 1 and the minimum about -0.5. As b increases, the maximum value does not appear to change but the minimum value drops to approximately -1, indicating that changing b affects more than just horizontal compression.
Vary c: Finally, keep a = b = 1 and let c vary. See a movie of how h changes with varying values of c. When you finish viewing the movie, press the Back button to return to this page.
The sliding values of n = c (from 0 to 15) clearly display why sines and cosines are referred to as wave functions! Varying c appears to affect both the horizontal and vertical translation of the graph, but it also affects the shape. As c increases, the graph appears to translate to the left, (but also up and down); when c decreases, the graph appears to translate to the right, as well as up and down. When c = 0, and periodically thereafter (about c = 3, 6, 9.45, 12.45), the graph resembles a simple sine wave with an amplitude nearly equal to 1. In between those values of c, (at about c = 1.5, 4.5, 8, 11), the graph again appears to resemble a simple sine wave with an amplitude of approximately 1/4, translated up or down off the x-axis. So c definitely affects the shape of the graph, not just the shift.
Now...view some examples below where a, b, and c vary.
 |
In the purple graph, a
= 3, In the red graph, a
= 2, |
 |
In the blue graph, a
= 5, In the green graph, a
= 2.5, |
I can only conjecture, at this point, that the composition of f and g is a rather complex combination of sine and cosine functions.
Return to the Write-Ups on Amy's Class Page