Coefficients
of a Parabola
Kim Seay
EMAT 6680
 The standard form of a quadratic
equation is given above (where a, b, and c are constants). The
graph will be a parabola. I would like to explore what happens
to the graph of the parabola as the coefficients a, b and c vary.
The standard form of a quadratic
equation is given above (where a, b, and c are constants). The
graph will be a parabola. I would like to explore what happens
to the graph of the parabola as the coefficients a, b and c vary.
The coefficient
"a"
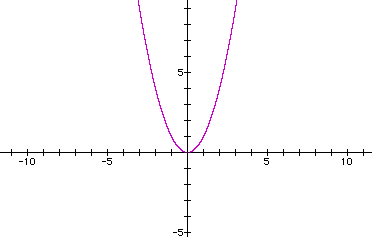
By definition of a quadratic
equation, "a" cannot equal zero. Let's begin by looking
at the simple case where a=1 , b=0, and c=0.
 What happens to the graph
as "a" changes? I will now graph several variations
of "a" on the same axis to compare.
What happens to the graph
as "a" changes? I will now graph several variations
of "a" on the same axis to compare.
 -Purple
 -Red
-Red
 -Dark
Blue
-Dark
Blue
 -Green
 -Light
Blue
-Light
Blue
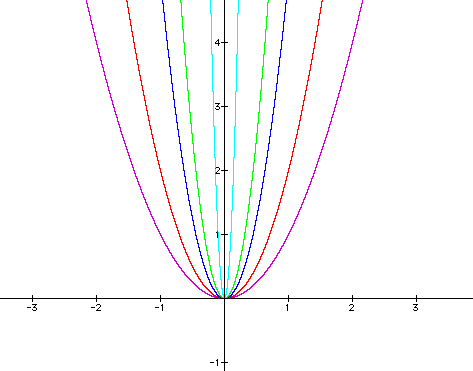 The parabola is keeping
it's same vertex, but seems to be getting more narrow as "a"
increases. Let's look at some negative "a" values.
The parabola is keeping
it's same vertex, but seems to be getting more narrow as "a"
increases. Let's look at some negative "a" values.
 -Purple
 -Red
-Red
 -Dark
Blue
-Dark
Blue
 -Green
 Light Blue
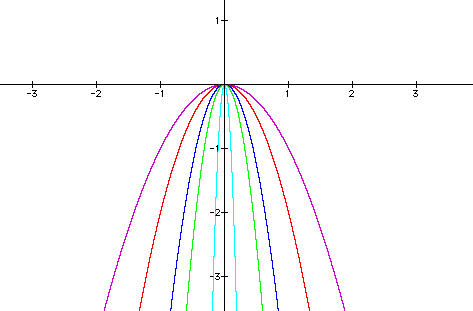
The graphs of the negative "a"
values are a reflection of their positive graphs.
Click here to see a Quick Time movie of the graph
as a changes from -100 to 100. Note that when a=0, the equation
becomes y=0, and the graph is a horizontal line through the x-axis.
The coefficient
"b"
In order to see the changes
in the coefficient b, I will keep a = 1 and c = 0. The first graph
where b = 0 has been graphed above. I will now graph b=0, b=1,
b=-1, b=5, and b=-5 on the same graph.
 -Purple
 -Red
-Red
 -Blue
-Blue
 -Green
 -Light Blue
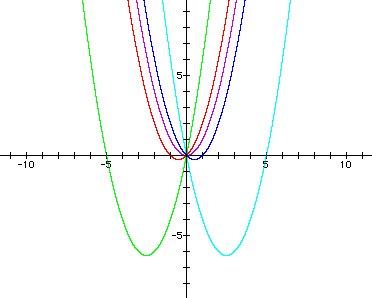 In each of the above equations,
the parabola intersects the x-axis at "-b".
To investigate this further,
click here for a Quicktime movie to see
what happens as "b" changes from -20 to 20. The parabolas
continue to cross the x-axis at "-b". The graph passes
through quadrants 1 and 4 when "b" is negative, and
quadrants 2 and 3 when "b" takes on positive values.
In each of the above equations,
the parabola intersects the x-axis at "-b".
To investigate this further,
click here for a Quicktime movie to see
what happens as "b" changes from -20 to 20. The parabolas
continue to cross the x-axis at "-b". The graph passes
through quadrants 1 and 4 when "b" is negative, and
quadrants 2 and 3 when "b" takes on positive values.
The coefficient
"c"
Again, we will keep the
other two coefficients constant while we observe changes in the
graph as "c" varies. When a=1 and b=0, let's graph the
functions where c=0, c=1, c=-1. c=5, and c=-5 on the same graph.
 -Purple
 -Red
-Red
 -Blue
-Blue
 -Green
 -Light Blue
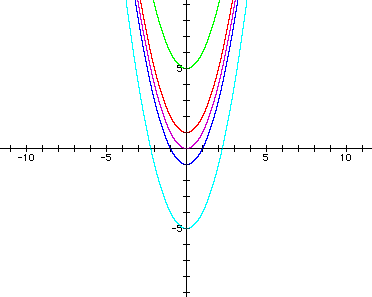 As "c" changes,
the parabola moves up or down the y -axis. In fact, it appears
that "c" is where the graph intercepts the y-axis. Click here to see changes if this remains
true as "c" varies from -50 to 50.
As "c" changes,
the parabola moves up or down the y -axis. In fact, it appears
that "c" is where the graph intercepts the y-axis. Click here to see changes if this remains
true as "c" varies from -50 to 50.
Conclusion:
I think this exploration
would be very beneficial to students. Every Algebra 2 student
is required to know how the coefficients of a parabola affect
its' graph, but I'm sure very few are given the opportunity to
discover this on their own. Most are probably given rules to copy
and memorize where "a", "b", and "c"
have no real meaning. Students may not be able to do this type
of visualizing in their head. I chose this as a write-up, because
it is such a common mathematical problem that all college bound
students should be exposed to in this method.
Return