
Today we will be exploring the graph of x +y= 1 as x and y are increasing in exponents and we will be able to see the changes in the graphs and see if we can find a pattern.
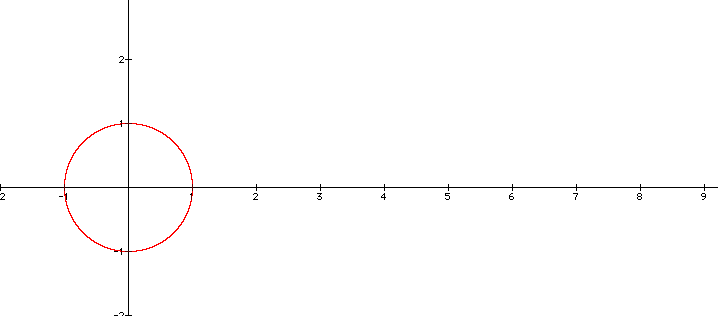
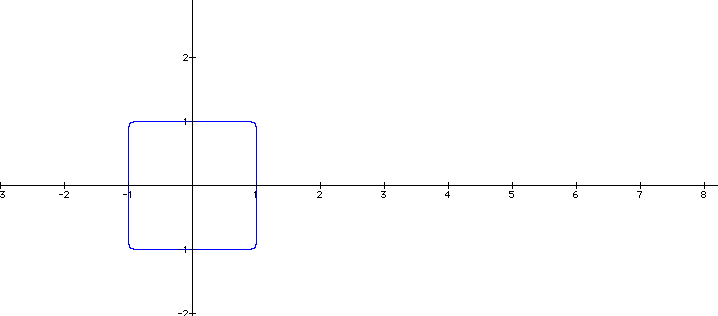
Our first graph is:
![]()
Lets look at ![]()
The Next graph will give us the following:
So it looks like the even numbers start out
as a circle and the odd numbers almost form half a square,but
the graph of![]() should looks more like a square
than a circle. So up to this point we see that both are getting
more square around the edges as we increase our exponents.
should looks more like a square
than a circle. So up to this point we see that both are getting
more square around the edges as we increase our exponents.
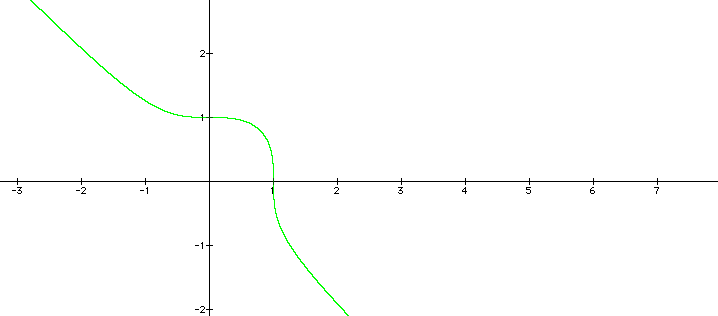
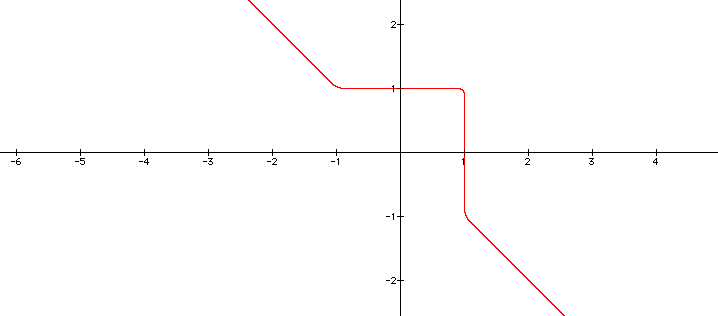
![]() this should go
around the origin forming half a square. Is it getting closer
to two sides of a square, but near the bottom of the graph, it
is still curving as it tails off.
this should go
around the origin forming half a square. Is it getting closer
to two sides of a square, but near the bottom of the graph, it
is still curving as it tails off.
So lets look at the next. ![]() As
we are getting larger even numbers it looks like we are getting
closer to a square. Lets see what this gives us.
As
we are getting larger even numbers it looks like we are getting
closer to a square. Lets see what this gives us.
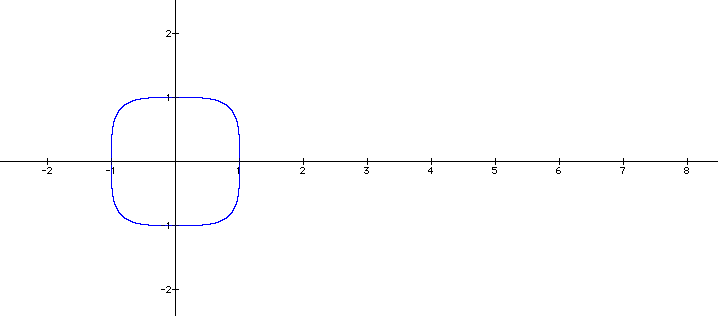
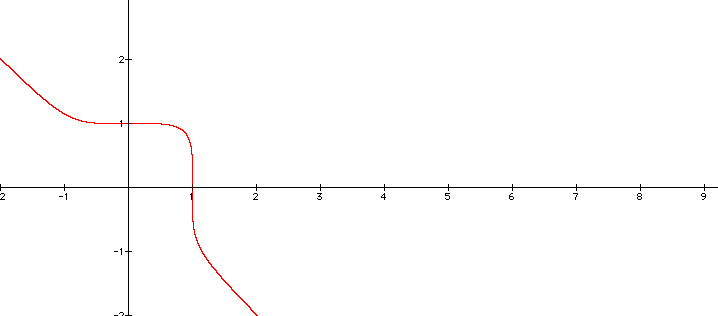
So lets now look at what it would be like to
the 25th. We would think that the edges will be less rounded than
before on the turns. Lets see what ![]() gives
us:
gives
us:
This gives us closer to two sides of a square with the line starting maybe near x = -y then taking a turn across the y-axis then almost making a ninety degree turn at (1,1), then crossing the x-axis and almost making another ninety degree turn downward along the x = -y line. So we get almost half a square with this graph.
So here is a combination of all the graphs as x and y increase and one can be able to see that as the odd powers go higher we draw closer to the line x = -y. In doing so, we get approximately half of the square formed by the even exponents. Here is a picture of all the above graphs in one:
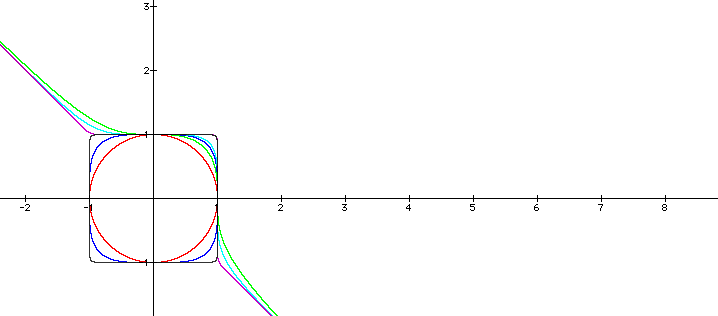
![]() is the red circle.
is the red circle.
![]() is the green line
that goes around the outside of the square.
is the green line
that goes around the outside of the square.
![]() is the blue line
that is in between the circle and the square.
is the blue line
that is in between the circle and the square.
![]() is the sky blue
line inbetween the green and purple lines near the x = -y line.
is the sky blue
line inbetween the green and purple lines near the x = -y line.
![]() is the black box
that almost forms a square with round barely on the corners.
is the black box
that almost forms a square with round barely on the corners.
![]() is the purple line
that looks like it traces the black square.
is the purple line
that looks like it traces the black square.
The following graph below we can see that with the x = -y green line drawn in each increasing odd exponent it touches the line for a longer time.
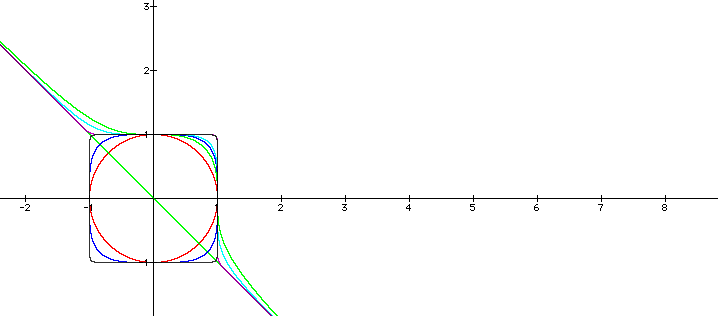
So as we can see the odd exponents draw closer to forming half of a squre while starting out on the x = -y line and then making turns sharper turns as it increases. The even exponents go from forming a circle to forming a squre.