DIVISION OF LINEAR
FUNCITONS
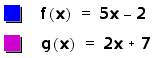 Here is the algebraic
representation of dividing these linear functions.
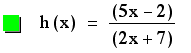
Here is the algebraic
representation of dividing these linear functions.
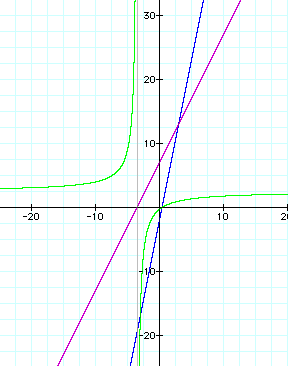
 We definately get something
interesting here.
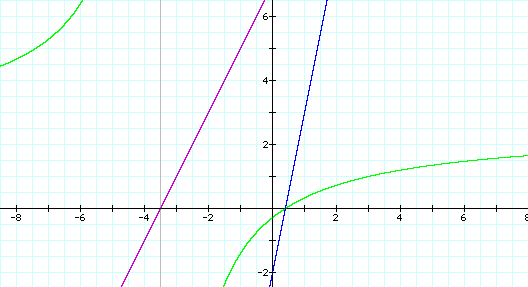
There is an asymptote
for the quotient function h(x), which is pictured as a grey line
on the graph.
We definately get something
interesting here.
There is an asymptote
for the quotient function h(x), which is pictured as a grey line
on the graph.
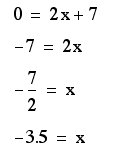
 How do we know where
this asymptote will be?
Well, as we saw on
the first page, we know that the denomenator cannot equal zero.
So, what the asymptote
represents is each side of the graph approaching that point when
the denomenator equals zero.
How do we know where
this asymptote will be?
Well, as we saw on
the first page, we know that the denomenator cannot equal zero.
So, what the asymptote
represents is each side of the graph approaching that point when
the denomenator equals zero.
 It is a bit easier
to see in this picture that the asymptote crosses at -3.5, just
as our algebra tells us.
It is a bit easier
to see in this picture that the asymptote crosses at -3.5, just
as our algebra tells us.
 To know that this line
represents an asymptote rather than just a hole in the graph it
may be helpful
to look at a chart
that numerically shows what x does as it approaches -3.5 from
both sides.
To know that this line
represents an asymptote rather than just a hole in the graph it
may be helpful
to look at a chart
that numerically shows what x does as it approaches -3.5 from
both sides.
|
X |
h(x) |
|
-3.6 |
100-3.5 |
|
-3.55 |
197.5 |
|
-3.51 |
977.5 |
|
-3.49 |
-972.5 |
|
-3.45 |
-192.5 |
|
-3.4 |
-95 |
From this chart we
can see that the closer we get to -3.5, the numbers begin to approach
infinity.
So, we can conclude
that from the quotient of two linear functions we will get and
asymptote and two hyperbolas.
Discontinuity will
occur when the denominator equals zero, and the asymptote will
be at x= -d / c fro our general equations.
Return to
Main Investigation