
Some Different Ways to Examine
by
James W. Wilson and Ben Mobley
University of Georgia
It has now become a rather
standard exercise, with availble technology, to construct graphs to consider
the equation
ax2
+ bx + c = 0
and to overlay several
graphs of
ax2 + bx + c = y
for different values of a,
b, or c as the other two are held constant. From these graphs discussion of the
patterns for the roots of
ax2 + bx + c = 0
can be followed. For
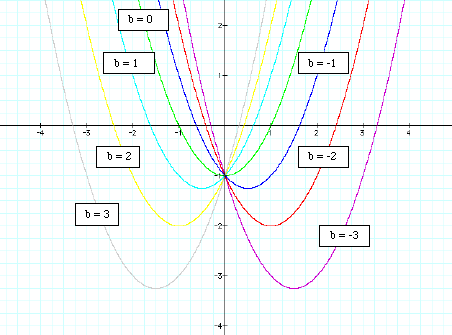
example, if we set
y = x2
+ bx + 1
for b = -3, -2, -1, 0, 1,
2, 3, and overlay the graphs, the following picture is obtained.
![]()
![]()
![]()
![]()
![]()
![]()
![]()
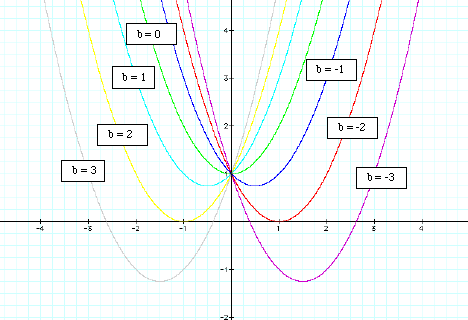
We can discuss the
"movement" of a parabola as b is changed. The parabola always passes
through the same point on the y-axis ( the point (0,1) with this equation). For
b < -2 the parabola will intersect the x-axis in two points with positive x
values (i.e. the original equation will have two real roots, both positive).
For b = -2, the parabola is tangent to the x-axis and so the original equation
has one real and positive root at the point of tangency. For -2 < b < 2,
the parabola does not intersect the x-axis -- the original equation has no real
roots. Similarly for b = 2 the parabola is tangent to the x-axis (one real
negative root) and for b > 2, the parabola intersects the x-axis twice to
show two negative real roots for each b.
So by overlaying several
graphs of y=ax2+bx+c (varying a, b, or c and holding the other two
constant) we can illustrate some information about the roots of each resulting
equation. As useful as this approach is, it might be clearer if we could
somehow use the graph of just one equation to demonstrate this same
information.
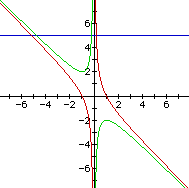
Graphs in the xb plane.
Consider again the
equation
x2 + bx + 1 = 0
Now graph this relation in
the xb plane by substituting y for b in the equation above. We get the
following graph.
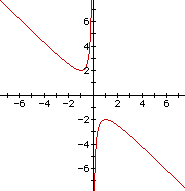
If we take any particular
value of b, say b = 3, and overlay the graph of this equation on the graph we
add a line parallel to the x-axis. If it intersects the curve in the xb plane
the intersection points correspond to the roots of the original equation for
that value of b. We have the following graph.
For each value of b we
select, we get a horizontal line. It is clear on a single graph that we get two
negative real roots of the original equation when b > 2, one negative real
root when b = 2, no real roots for -2 < b < 2, One positive real root
when b = -2, and two positive real roots when b < -2.
So we have been able to
illustrate the same information about the roots of the equation but with a much
simpler series of graphs.
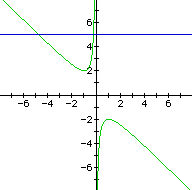
Consider now the case when c = - 1 rather than + 1. Now our equation is
x2
+ bx - 1 = 0
If we plot this equation
in the xb plane just like before we get the following graph (in red).
Now we can see that for
any value of b we can plot a horizontal line that intersects our new graph at
two points. These intersections correspond to one negative real root and one
positive real root for all values of b.
We could show this using the first approach we looked at by overlaying the graphs of
y = x2
+ bx - 1
for different values of b.
We would get the following series of graphs.
![]()
![]()
![]()
![]()
![]()
![]()
![]()
Now all of the parabolas
cross the y-axis at the point (0, -1). We can further see that each parabola
intersects the x-axis at two points corresponding to one negative real root and
one positive real root. This agrees with what we found by plotting the original
equation in the xb plane. But overlaying several graphs can lead to a crowded
illustration. Plotting in the xb plane produces a more visually clear
demonstration.
These concepts can be
extended to the xa and xc planes as well.
Send email to jwilson@coe.uga.edu or bmobley@uga.edu
Return to EMAT 6680 Home Page