

Problem Statement: Examine the graph y= a sin(bx+c)
Problem Setup: This purpose of this is to determine how different values of a, b, and c change the graph of the sine function. The purpose of this problem is to determine why parameters a, b, and c change the graph of the sine function.
Plans to Solve/Investigate the Prolem: My plan is to investigate the link between the graph y=sinx and the unit circle and right triangle definitions of the sine function. Using the link between the unit circle and the graph y = sin(x) I believe that I can determine and explain how the parameters a, b, and c change the graph of y= sin(x). I plan to investigate each parameter separately.
Investigation/Exploration of the Problem:
I began by graphing the function y = sin(x) on Graphing Calculator 3.2
![]()

I wanted to know what it would look like if I changed parameter a, in other words what happens if I put in different values for a in the equation y=a sin(x). The values I put in for a included 1,2,3,-1, and 1/2.

After examining this graph I graphed the unit circle on geometers sketch pad. The unit circle is a circle with a radius of one. Inside of the circle I constructed a right triangle. I constructed the triangle to view the relationship between the height of the triangle and the sine of an angle. In the unit circle, the radius is one unit. Since the radius is one and the sine of an angle is y/r, where y is the opposite side from the angle and r is the radius, the sine of an angle as viewed from the unit circle is y. In this case, the y value, the side opposite from the angle is the height of the triangle. So the sine of an angle in the unit circle is the height of the subsequent triangle.
Click HERE to view the unit circle with a right triangle constructed inside. The vertex of the right triangle which touches the circumference of the circle rotates around the circle. As the triangle rotates around the circuference of the circle one can see the height of the sine function. The height of the sine function can only have a range from [-1,1] as viewed in the unit circle. The height of the sine function graphed on graphing calculator is equivalent to the height displayed in the unit circle.
As the vertex of the triangle moves around the circle one can see the height at the following angles:
sin (0) =0
![]()
![]()
![]()
and
![]()
Because the height of the angles only includes the values -1 to 1 inclusively the amplitude of y= sin(x) is 1 in the sine function.
When the sine function is multiplied by a number a, the amplitude of the function is then changed. From the unit circle you know that the height of the triangle determines the sine of the angle. So, if one takes the following equation:
![]() where
where ![]() ,
,
then y =2 (1) = 2 . All angle measures are subsequently multiplied
by a factor of two thus changing the functions amplitude to two
and accounting for the waves height of two. If a is negative the
graph is reflected across the x-axis because sine of 90 degrees
(![]() ) is now negative and the sine
of 270 degrees (
) is now negative and the sine
of 270 degrees (![]() ) is know positive.
) is know positive.
This confirms the movement of a that one would expect.
Click HERE to open a graphing calculator file where a changes from -10 to 10.
Now that we know how and why parameter a changes the graph y = sin(x), let's explore parameter b.
The following is a graph of y=sin(x) (in blue), and y=sin(2x) (in red).

Click HERE to view the graph y=sin(bx) as b changes from -10 to 10.
As one can observe from this graph the bigger b gets the more the sine waves are smushed together and the smaller y gets the further the sine waves are apart until they approach what looks like the straight line y=0. As b goes negative the sine waves appear to reflect about the x-axis. The reason for this is that as b gets larger the sine wave squishes together can be illustrated through the following:
when y = sin(x) and x =0 the y = 0 and when
![]()
However, for y = sin(2x) when x=0 , y still equals 0, but when
![]()
also because:
![]() .
.
y=1, then when x=pi/4 because sin(2x) when x=pi/4 is equivalent to the sin(pi/2), therefore making y equivalent to one.
Therefore the amplitudes of one and negative one in this case are reached quicker than when y=sin(x). This explains why as b gets large the graph of the sine function squishes together. The same argument holds as b gets smaller. As b goes negative the sine function is again reflected about the x-axis. This argument holds becasue one travels around the unit circle counter clockwise from 0 if the angle is positive and clockwise from 0 if the angle is negative. If one views the unit circle and travels counter clockwise pi/2 radians the height of the triangle is one, when traveling pi/2 radians from 0 clockwise the height of the triangle is -1. Therefore:
![]()
These sine waves smushed together and pulled apart just as the positive b's did but were simply reflected about the x-axis.
How does parameter c affect the graph y=a (sin(bx+c))?
I began by fixing a and b at one and graphing c for 0 (purple), 1(blue),1/2 (red), -1(green),
2 (light blue) and -2 (black).

One can see how c affects the graph by doing a little bit of algebra.
Looking at the equation y = sin(x) for

You can determine by viewing the unit circle that y=1 in this case. Now as a decimal x is approximately equal to 1.57. If I look at the equation y=sin(x+1) for x=1.57, I am looking at the equation y=sin(1.57+1), therefore y = sin(2.57) approximately. Now
is approximately equal to 3.14 as a decimal. If one looks back at the unit circle one can determine that for y=sin(x+1) when

That y is between
and
and therefore will be located in quadrant II of the unit circle. So in the case of c=1, the graph y = sin(x) is shifted to the left one unit just as it is moved to the left on the unit circle.
Here is the graph of y = sin(x) (in red) and y=sin(x+1) in blue

Click HERE to view the unit circle again for clarification.
If c=2, the graph will be moved to the left 2 units. When c goes negative the graph is moved to the right instead of the left.
Click HERE to view the graph y=sin(x+c) as c changes from -5 to 5.
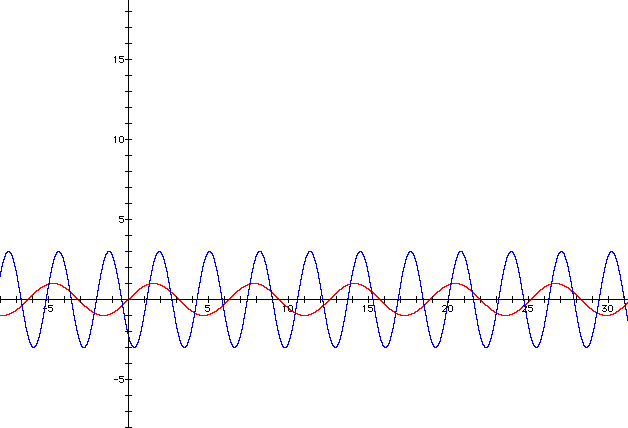
So in conclusion, the graph y= 3 sin (2x+4) will transform the graph y= sin(x) by changing the amplitude to 3, squishing the graph together, and then moving the graph to the left 4 units.
y = sin(x) is in red and y=3 sin(2x+4) is in blue
Extensions of the problem: In order to extend this problem one can investigate how the parameter a, b, and c affect the cosine function. In other words what happens to the graph y=a cos (bx+c) as a, b, and c vary. One could also do investigations with the tangent function.
Investigation of the Extension:
When I graph y = cos (x) on graphing calculator I end up with the following:
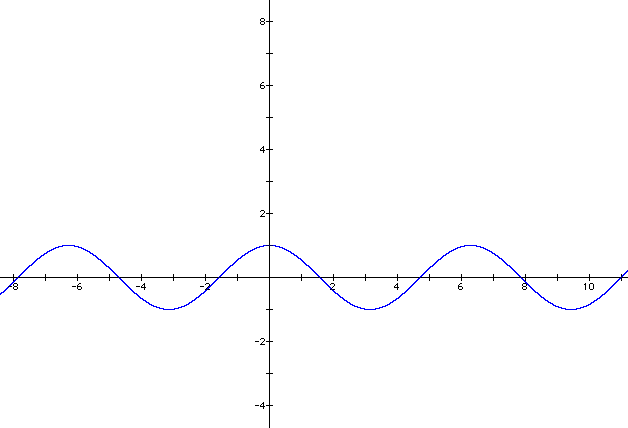
Going back to my unit circle, which has a radius of one unit, I note that the cosine of an angle is x/r (or the side adjacent to the angle/ the radius). Since the radius is one the side adjacent to the angle represents the cosine. The side adjacent to the angle for the
cos(0) = 1, this is because at 0 radians the angle is on the x-axis along the radius of the unit circle which is one.
Click HERE to view gsp file which displays this unit circle. One can also see from this unit circle that as the cosine, which lies along the x axis, becomes larger the sine, which is the height of the triangle becomes shorter.
Anyhow by viewing the unit circle one can see the following information:
![]()
![]()
![]()
![]()
By examining the graph y= a cos(bx +c) for a, while setting b at 1 and c at 0 for a=1 (in blue) and a =2 (in red), yields the following graph:
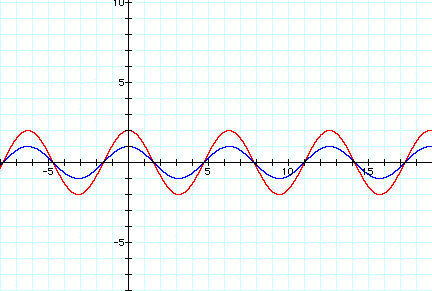
As one can see the amplitued is increased by a factor of two. This is the same thing that happens to the sine function. The reasoning for this is the same as for the sine function, the cosine of the angle is multiplied by 2 thus stretching the cosine out by a factor of two. cos(0)=1, 2 cos(0) = 2.
Click HERE to see the graph as a ranges from -5 to 5, once again as the a goes negative the graph reflects about the x-axis.
Because of this phenomenon, I would tend to think that changing the parameter b, and c in the function y=a cos(bx+c) would have the same affect that it did on the sine function.
I next decided to fix a at one and c at 0 and to let b vary. Here is a graph of y= cos(x) (red), and y=cos(2x) (blue):
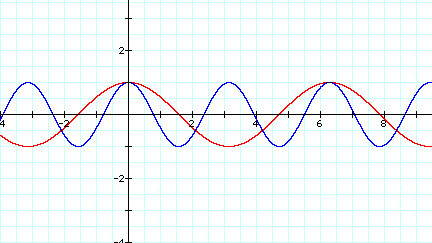
Once again as b get larger the graph smushes together just like it does in the sine function.
Click HERE to view the graph y=cos(bx) as b changes from -5 to 5.
I know investigated what would happen if I changed c, Here are the graphs of y=cos(x) (blue)and y=cos(x+1) (red). This again moves the graph one unit to the left.
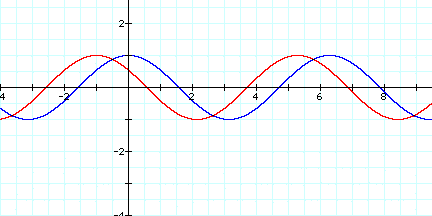
So, as one can see the parameters a, b, and c affect the graph of the cosine function in the same manner and for the same reasons they affect the sine function.
Author & Contact:
Jennifer Shea
Click Here to e-mail me.
Links to Resource Material:
trigonometry and analytical geometry