Let us consider two points (3,4) and (-5,-2). For any point (x,y) we can write the distance equations for these as
Let us take ![]() and
and
![]() for
several values of 'n' which is any number
greater than or equal to 0 (zero). Let's give several numbers
for n see the graphs for this function.
for
several values of 'n' which is any number
greater than or equal to 0 (zero). Let's give several numbers
for n see the graphs for this function.
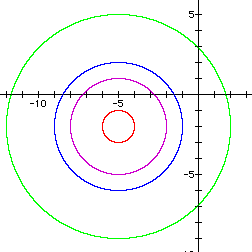
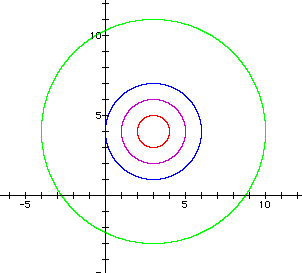 For n=1 (Red circle) For n=3 (Blue circle) |
For n=1 (Red circle) For n=4 (Blue circle) |
|
As it is seen from the Figure 1 and Figure 2 above, when we draw the graph of a distance equation, it is just the circle centered at the given point with radious n. Morever, we may observe from these figures that when n gets larger then radious of the circle gets larger without any change in the location of the circle.
In fact, what we have observed here is that "a circle is the set of all points in a plane whose distances from a fixed point is a constant (here 'n')".
Now, let see if there is change when we connect
these two distance equation. Let's first look at what will happen
if we take sum of them.i.e.,![]() for several values of 'n' which
is any number greater than or equal to
0 (zero).
for several values of 'n' which
is any number greater than or equal to
0 (zero).
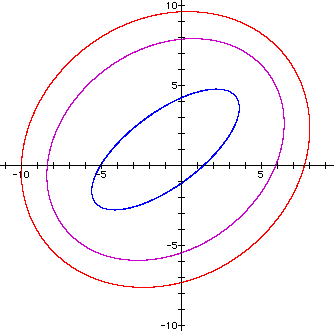 For n=11 (blue ellipse) For n=19 (red ellipse) |
From Figure 3, we have observed that if we sum two distance function, we obtain a function of an ellipse.
In fact, what we have observed here is that 'an ellipse is the set of point in a plane the sum of whose distances from two fixed points F1 and F2 is a constant'. These two fixed points are called the foci (plural of focus).
In our case, the foci of the our ellipses are the points (3,4) and (-5,-2). Furthermore, when the sum of the distances become larger (i.e. n becomes larger), the ellipse becomes larger without any change in its foci.
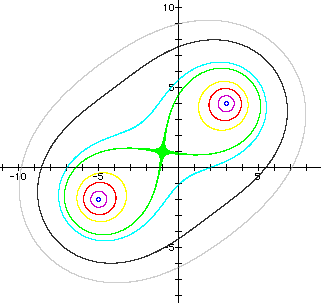
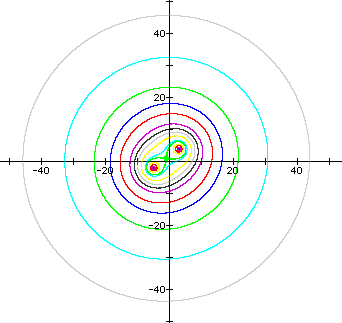
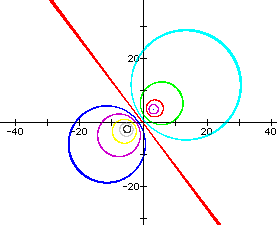
Now, let's observe what will be the figure if we multiply two distance fuction. In other words, what will be the graph of
|
For n=1, 5, 10, 15, 25, 30, 50, 70 from inside to outside. |
|
This time we get really nice graphs. In Figure 4, at first the graphs looks like small circles centered at on first and third quadrant. But then, they become to get close as if they want to meet at the mid pont of the distance between the points (3,4) and (-5,-2). At the midpoint, two distinct graphs meets and the figure (green one, n=25) looks like an eyeglasses. On the other hand the small graphs (blue, pink, red and yellow ones) inside this eyeglases look like the eyes.
From this point, when n gets larger values, there appears one figure for each value of n and looks like ellipses. On the other hand, if we look at Figure 5, for bigger values of n, the graphs becomes closer to graph of a circle.
Now, let's observe what happens to the graph of our function, if we substract them. In other words, what will be the graph of
|
|
|
|
First of all, our graph is not satisfied in
the region shown except for the interval-10![]() n
n![]() 10 . Why? (Exercise!...)
10 . Why? (Exercise!...)
Contary to above graphs, since we substract two distances we may get negative values for n in this case. for example for n=-10, we get the blue ray focused to the origin. It looks like a little bit planar object. When n gets larger values, the blue ray becomes like a "thick" parabola whose vertex is closing to the origin. When n=0, the thick planar parabola looks almost like an thick line passing through the origin. For n>0, we get the symmetric graps of the graphs for the values n<0. It can be observed from Figure 6.
In fact, all of the graphs above are hyperbolas. What we have observed here is just the definition of a hyperbola, the set of all points in a plane the difference of whose distances from two fixed points F1 and F2 (the foci) is a constant. In our case th foci are (3,4) and (-5,-2).
notice that the definition of a hyperbola is similar to that of an ellipse; the only change is that the sum of distances has become a difference of distances.
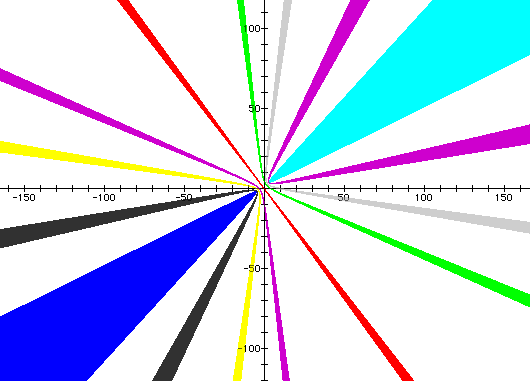
Now let's look at the graph of the function if we divide the two distance formula. In other words, what will be the graph of
|
 |
For n=1 (red)
Right side of n=1 (red line) n=1/7 (pink) n=1/4 (red) n=1/2 (green) n=3/4 (light blue)
Left side of n=1 (red line) n=3/2 (blue) n=2 (pink) n=3 (yellow) n=5 (gray) n=9 (black) |
From Figure 7, we may observe that when n=1 the graph becomes like a line passing through origin. Furthermore,this line becomes thicker and thicker, while the line goes away from the both sides of the origin. If we rearrange the formula for the function for n=1, then we get that Distance1-Distance2=0. In fact as we observed above (the subtraction of distances part), this is an hyperbola. But, in this case since the set of all points in the plane the difference of whose distances from two fixed points (3,4) and (-5,-2) (the foci) is a zero, our graph looks like a line. On the other hand for 0<n<1, our graphs looks like inflated ballons. when n gets closer to 1, the ballon gets larger. On the other hand, when n get values bigger that one (1), the ballons get smaller and smaller.
Exercise-1.
Investigate the graph of ![]() for several values
of n and compare with the ones in Part 3. Are they same? If not,
Is there any relation between them?
for several values
of n and compare with the ones in Part 3. Are they same? If not,
Is there any relation between them?
Exercise-2.
Investigate the graph of 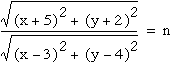 for several values
of n and compare with the ones in Part 3. Are they same? If not,
Is there any relation between them?
for several values
of n and compare with the ones in Part 3. Are they same? If not,
Is there any relation between them?
Send me your responses via
e-mail : aerbas@coe.uga.edu