The behavior of sequences and series has been a topic of mathematics study for hundreds, if not thousands, of years. The works of Cauchy and Weierstrauss are excellent examples of this study. We can admire the patience and determination of these men when we consider that the only tools that they possessed to acomplish their work were simple pen and paper. Luckily, we now have the personal computer to do all of the tedious work and we only have to interpret the results.
Nearly every personal computer today has some brand of spread-sheet software installed. If your computer runs Microsoft Windows, the chances are that this software is Microsoft Excel©. Excel has many features that allow us to model and graph the behavior of sequences and series. We will now investigate several sequences and series using Excel to demonstrate.
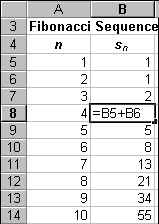
A good sequence to start with is the Fibonacci sequence. This sequence often occurs in nature. The sequence begins 1, 1, 2, 3, 5, and each succeeding term is the sum of the previous two terms. We can model the Fibonacci sequence in Excel by doing the following. Choose a cell and enter the character n. In the adjacent cell to the right enter s-subscript-n. Now, in the cell below the one labeled n, enter a one. Enter a two in the cell below that one. Now, highlight the one and the two, then do a drag and fill by placing your cursor on the lower right hand corner of the cell containing the two and holding down the left mouse button while you drag the cursor downward. Drag and fill until n = 50. Now, label the next column Fibonacci. In the first and second cells below the label, enter a one. In the third cell below the label place the following formula, = B3+B4, where B3 and B4 are the cell references for the two cells containing the ones. See the high-lighted cell in the example below.
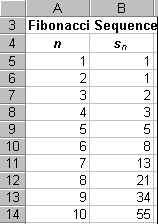
The first ten terms of the Fibonacci sequence, along with a graph, appear below.
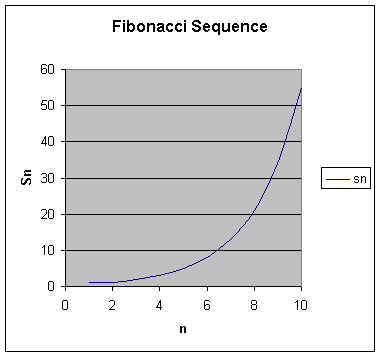
This sequence grows very rapidly. Mathematicians call this behavior divergence. If the sequence had tended toward a fixed number as n increased mathematicians would have said that the sequence converged.
Now we will look at a series that may or may not converge depending upon the value of one of the parameters. This sequence is the geometric sequence.
![]()
Try letting |r| < 1, say r = 0.5. We can quickly see how this sequence behaves by modeling it using Excel just as we did the Fibonacci sequence. The first ten terns of the sequence, along with a graph appear below.
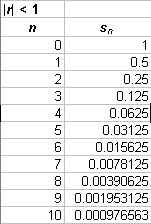
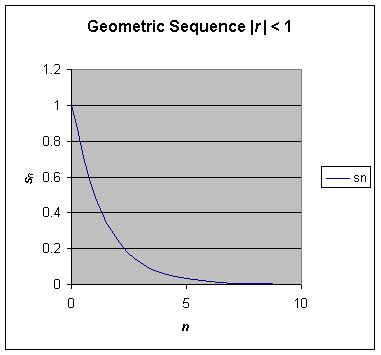
This sequence rapidly converges to zero. What would have happend if r had been greater than one? Let r = 2 and repeat the modeling. The first ten terms of this sequence with a graph appear below.
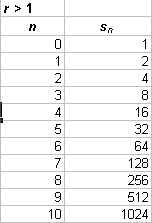
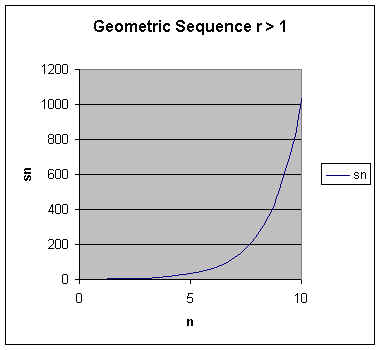
This time the sequence diverges rather rapidly. After all, what we are plotting are the powers of 2, which do increase very rapidly.
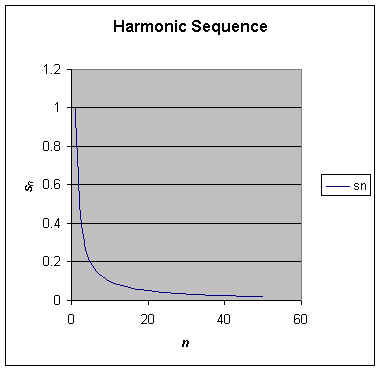
Let's now look at what is called the harmonic sequence.
![]()
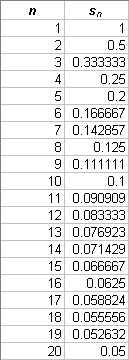
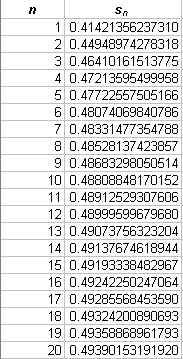
This is a very simple harmonic sequence. Without even graphing it we can see that it will converge to zero because the limit as n approaches infinity of 1/n is zero. We have included it here because it and the geometric sequence also appear as important series which we will discuss later. A list of the first 20 terms along with a graph of the first sixty terms are shown below. Notice that this sequence does not converge as quickly as the geometric series.
Two Other Interesting Sequences
Now let's look at a sequence that does not converge to zero
but does converge.![]()
This is a very interesting sequence in that it is not intuitive that it will converge. Again, using Excel, we can model this sequence. Excel is very flexible and has many internal functions. One of these is the SQRT() function which takes the square root of the argument in the parentheses. To calculate each term of the sequence we place the function =SQRT(A4^2+A4)-A4, where A4 is a representative of the cell reference containing the value of n, in each cell of the column that we wish to contain the sequence. The first 20 terms of this sequence and a graph of the first 100 terms appear below.
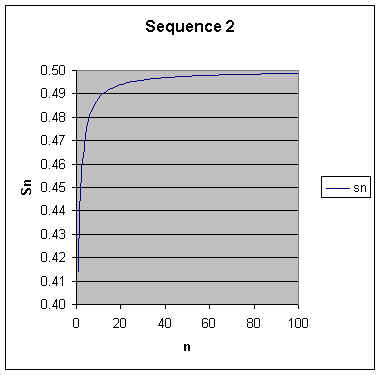
The terms quick approach 0.49 and then level off. From the graph it would seem that this sequence converges to 0.5. A good exercise would be to prove that this sequence converges to 0.5.
For our last sequence I have selected a recursive sequence. The Fibonacci sequence is also a recursive sequence, you say. That is true, but this sequence you will also find interesting I think.
![]()
So this time, in order to model the sequence we have to use the following formula in each cell of the column containing the sequence after the first cell.
=SQRT(2+SQRT(B5))
In this case, B5 refers to the cell immediately above the one containing the current value of the sequence. Notice that we do not need to use n to calculate the values of the terms of this sequence. The first ten terms of the sequence, along with a graph, appear below.
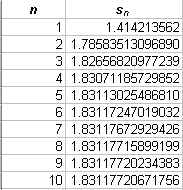
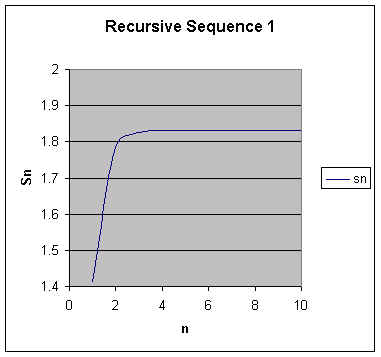
This sequence converges to the number 1.83117720720834 to 14 decimal places. I don't know whether this is a rational or an irrational number. However I suspect the latter but I haven't investigated it..
Series are similar to sequences. Actually, the main difference between a series and a sequence is that a series is the sum of the terms of a sequence. In a series, when mathematicians talk of convergence they mean that the infinite sequence sums to a finite number. How can the sum of an infinite series sum to a finite number? Well, a necessary criteria is that the terms of the sequence used have a limit of zero as n increases without bound. This is not sufficient however, as we will discover in our investigation of several series.
A harmonic series is just the infinite sum of a harmonic sequence. No harmonic series converge. Look at the first twenty terms of the harmonic series based on 1/n and its graph.
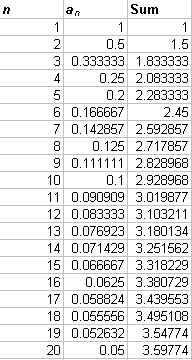
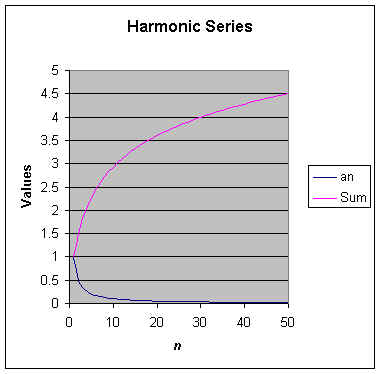
This harmonic series satisfies the necessary condition for convergence, but we can see that it will not converge. What are sufficient conditions for convergence in a series?

Some geometric series converge and some don't. What is the difference between them? In any basic analysis textbook you will find the following theorem:
Theorem: The geometric series
![]() converges to 1/(1-r)
if |r| < 1, and diverges otherwise.
converges to 1/(1-r)
if |r| < 1, and diverges otherwise.
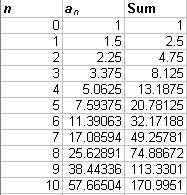
So a sufficient condition for convergence for a geometric series is that |r| < 1. Let r = 0.5. This series should converge by the theorem. The first 22 terms of the series and the graph appear below.
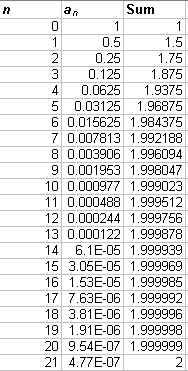
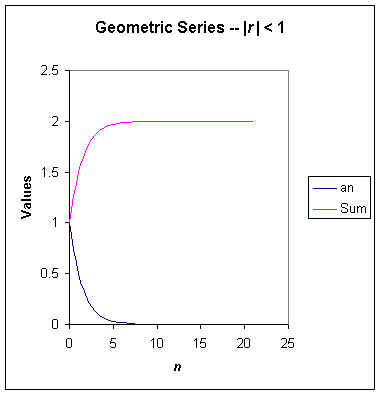
Well, the series converges to the predicted 1/(1-0.5) = 2 to
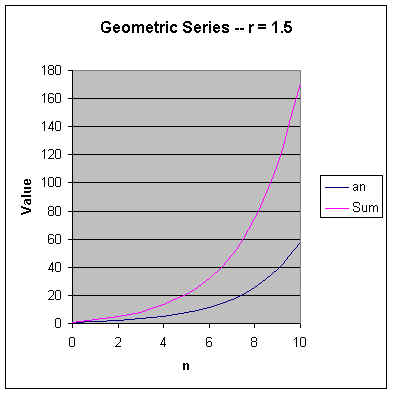
6 decimal places by the 21st term. What if we let r
= 1.5? Well it is obvious that the limit of ![]() as n increases without bound is not zero.
Therefore, this series does not even meet the necessary conditions
for convergence. To drive this point home, the first ten
terms of the series, along with the graph are shown below.
as n increases without bound is not zero.
Therefore, this series does not even meet the necessary conditions
for convergence. To drive this point home, the first ten
terms of the series, along with the graph are shown below.
So we can use these Excel demonstrations to demonstrate the validity of the theorem concerning geometric series. This, of course, is not a proof of the theorem.
Another theorem concerning series is called the comparison test. This theorem states:
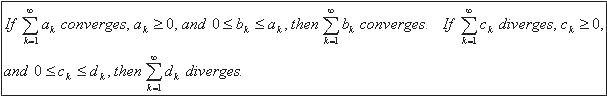
If there are any doubters in your classroom, you can use Excel to quickly convence them of the validity of this theorem. For instance, look at the series below.
![]()
Does this series converge or diverge? By the comparison test it diverges because
![]()
and the harmonic series ![]() diverges.
To convence your students, show them this.
diverges.
To convence your students, show them this.
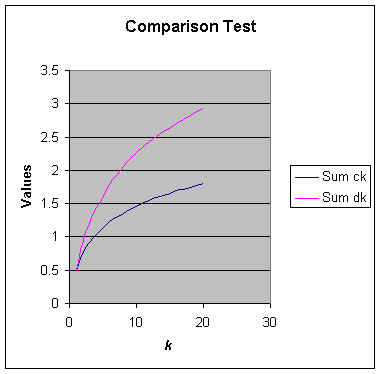
The pink line is the series in question, the blue line is the harmonic series used for comparison. This should convence most of your students.
Here is another type of series that may converge or diverge dependent upon the value of a parameter. The p - series has the form

This series converges if p > 1, and diverges otherwise. Again, Excel can be used to demonstrate this behavior. Let p = 0.5. The first ten terms and the graph of this series appear below.
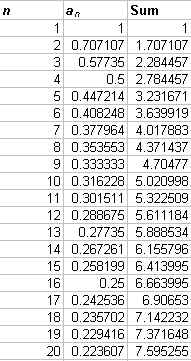
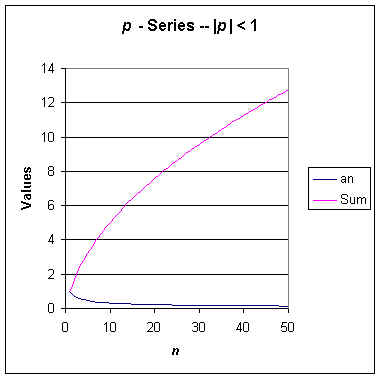
It is obvious from the graph that this series diverges. Although you might have to show your students a few more terms than shown here. Now let p = 2 and see what we get.
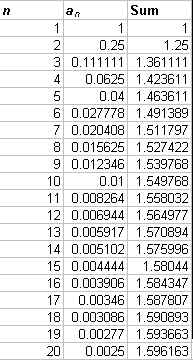
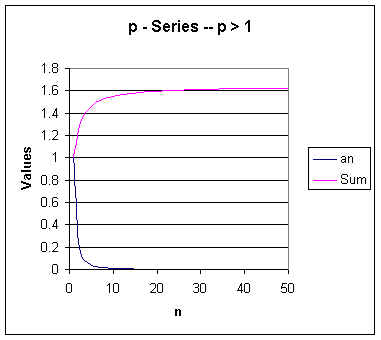
As you can see, this series converges. This series converges to less than 1.65.
As you can see, Excel is a very powerful tool to use for the investigation and demostration of sequences and series. You can show your students how to model sequences and series in Excel and then send them off to do their own investigations of sequences and series that may interest them. You students can use Excel to develop proofs of the convergence or divergence of particular sequences or series. I am not saying here that a demonstration of convergence or divergence using Excel is sufficient as a proof. I am only saying that the use of Excel in the investigation may help the student to develop a formal proof by way of the use of the various tests for convergence or divergence given in most basic analysis textbooks and in some calculus and algebra textbooks.
Excel is also a wonderful tool for introducing the concept of sequences and series. It is a very useful teaching tool for mathematics at this level even if it was not intended to be used as such. And, since most personal computers now have Excel or some other spread-sheet software, such as Lotus 1-2-3, installed, there is often no additional cost to the student to be able to use Excel in his work.