

To introduce a system of polar coordinates in a plane, we begin with a fixed point O (called the origin or pole) and a directed half-line (called the polar axis) with endpoint O. Next, we consider any point P in the plane different from O. If, as illustrated in Figure 1, r = d(O,P) and q denotes the measure of any angle determined by the polar axis and OP, then r and q are called polar coordinates of P and the symbols (r, q ) or P(r, q ) are used to denote P.

A polar equation is an equation in r and q . A solution of a polar equation is an ordered pair (a, b) that leads to equality if a is substituted for r and b for q . The graph of a polar equation is the set of all points (in an rq -plane) that correspond to the solution.
Since the polar axis coincides with the positive x-axis of the Cartesian system, the polar coordinates (r, q ) of a point P and the Cartesian coordinates (x, y) of the same point are related by the equations:
Using the basic overview, we can now discuss characteristics of certain types of polar equations. If a circle of radius a is centered at the pole, its equation is simply r = a, as illustrated in Figure 2.

If it is centered at (ro, q o), its equation is quite complicated unless we choose ro = a, as shown in Figure 3.

Then, by the Law of Cosines, a2 = r2 + a2 - 2a cos(q - q o), which simplifies into a general polar equation of a circle:
Notice that when q o = p /2, r = 2a cos(q - p /2) which implies r = 2a sin q is another general polar equation of a circle.
Using a Graphing Calculator program, it is easy to discuss the characteristics of such graphs as the following:
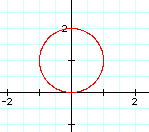
Notice that the first graph, r = 2 sin (q ) is a circle with radius 1 centered at (0,1) as depicted below.
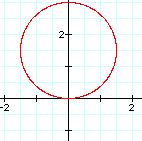
Additionally, the graph of r = 3 sin (q ) is a circle with radius 1.5 centered at (0, 1.5) as depicted below. From this point, teachers and students can discuss what they think the graphs of r = a sin (q ) would look like for increasing values of a.
Now, we turn no equations in the form r = 2 (sin kq ).
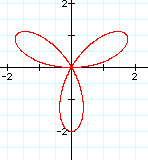
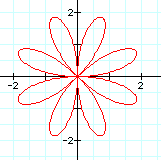
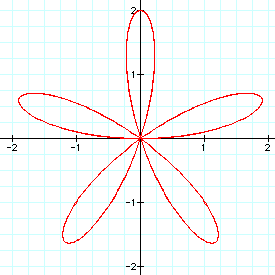
Respectively, the graphs of r = 2 sin (3q ), r = 2 sin (4q ), and r = 2 sin (5q ) are depicted in Figures, 6, 7, and 8 below. As with the previous graphs, students and teachers can discuss characteristics of the graph and what might be expected for increasing values of k.

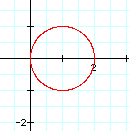
We turn our attention to graphs involving the cosine function. First, we’ll investigate graphs of r = 2a cos (kq ). Notice that the graph of r = 2 cos(q ), illustrated in Figure 12, is a circle with radius 1 centered at (1,0). Discuss the similarities and differences with this graph and the graph of r = 2 sin(q ) with your students.
Next, the graphs of r = 2 cos (3q ) and r = 2 cos (4q ) are illustrated below. Note the similarities and differences between these graphs and similar graphs using the sine function.
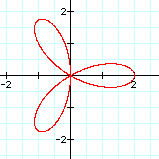
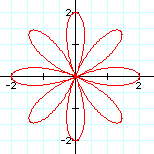
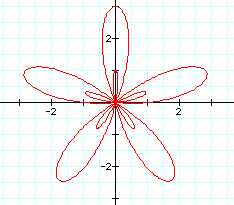
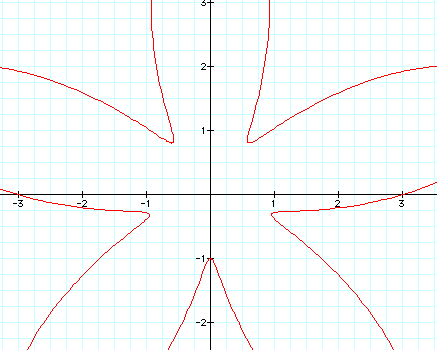
Lastly, similar to the sine function, as k increases in the equation r = 2 cos (5q ) + k as illustrated below, the graph seems to separate, also.
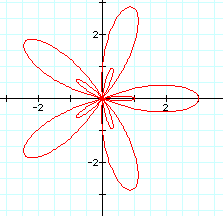
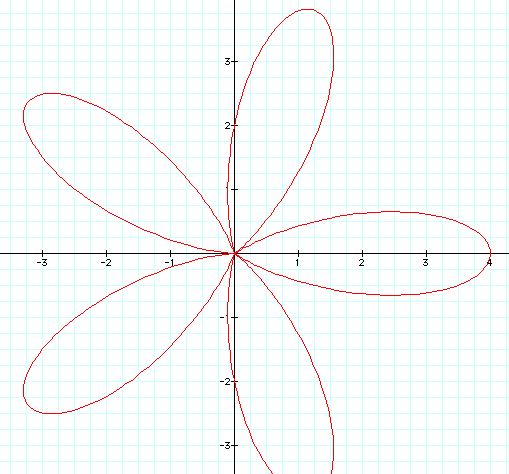
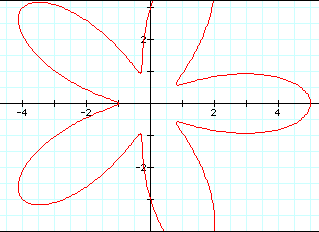
As the above illustrates and demonstrations indicate, discovering characteristics of graphs using such programs as Graphing Calculator 2.1 shows allows students to develop an understanding of the different characteristics of several different kinds of graphs. Discuss y-intercepts, number of pedals, and other general characteristics of these functions with your students.