
The concept of relationships between two variables is a common existence in everyday life. Functions in mathematics are special relationships. For instance, the amount paid for filling a tank of gas depends on the price of the gasoline and the capacity of the tank. For our purpose, we'll say that the price per gallon is 80 cents. So, if gasoline costs 80 cents per gallon, and we fill a tank with 10 gallons of gas, the total amount paid would be $8.00 (10 gallons @ 80 cents per gallon = 10 * $0.80 = $8.00). If we only put 5 gallons of gasoline in the tank, the total price would be $4.00 (5 gallons @ 80 cents per gallon = 5 * $0.80 = $4.00). Thus, the price we pay for gasoline, in this example, is a function of how much gasoline we put into the tank. More technical examples and definitions of functions are given in the section, "When is a Relation a Function?"
Basically, a function is a mathematical procedure performed on a number to produce another number with certain limitations imposed. For instance, take the number 2, multiply it by 5 and add 10. You should end up with 20. Now take the number 3 and perform the same mathematical operations and you should obtain 25. Finally, take the number -4 and perform the same operations and you should obtain -10. So, what we're doing is taking any number, let's call it x, multiplying it by 5 and adding 10. Let's call our answer y. A short-hand mathematical way to indicate this is to write our procedure as y = 5x + 10, where x can be any number in this case. So, one of the main points regarding the concept of functions is that you will be performing mathematical procedures on numbers to obtain an answer. Since y = 5x + 10 is a function, we can also use the functional notation, f(x) = 5x + 10 to represent our function. The f(x) notation is explained futher in the Functional Notation section of this lesson.
You must be able to determine when a relation is and is not a function.
Definition
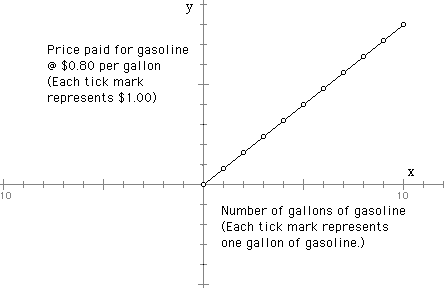
Let's look at a chart, as illustrated below, that depicts the total cost of gasoline as a function of the quantity of gasoline put into a tank. We will determine how much 0 gallons of gasoline cost up to 10 gallons of gasoline. The amount of gasoline is in the first column. For standardization purposes, we'll call this column, "column x".You can name this variable anything, not just x. For example, you may want to name it g for gasoline. So, basically the first column is your question, "How much gasoline am I putting into my gasoline tank?" The term given to these values (the values in the first column) is the domain of the function. The elements of the domain are also called the independent variable. The second column is the "answer" you get to each question, after substituting each value (amount of gasoline) in for x. In this example, the variable amount runs from 0 gallons of gasoline (x = 0) through 10 gallons of gasoline (x = 10). For example, 0 gallons of gasoline cost$0.80 * 0 = $0.00, 1 gallon of gasoline costs $0.80 * 1 = $0.80 or 80 cents, and 10 gallons of gasoline cost $0.80 *10 = $8.00. Again, for standardization purposes, we'll call this column of answers column y. The term range is given to the answers you obtain when substituting all of the values of the domain into a function. The elements in the range are also called the dependent variable , as the values of the dependent variable depend on the values of x (the independent variables, x, or the elements in the domain) that you substitute into the function.
|
|
|
|
|
|
|
|
|
|
|
|
|
|
|
|
|
|
|
|
|
|
|
|
|
|
|
|
|
|
|
|
|
|
|
|
Notation of the Domain and Range
In our beginning gasoline example, we determined how much we would pay for gasoline at 80 cents per gallon for various amounts of gasoline. The amounts of gasoline ranged from 0 gallons to 10 gallons. You may see this domain depicted in several ways. The first way may be just a verbal description that states, "x runs from 0 to 10." A second way to explain the dimension of the domain is in set-builder notation as: 0 £ x £ 10. Another way may be in interval notation as: [0, 10]. Do not confuse interval notation with coordinates of a function. Interval notation represents the values in a domain and is illustrated by two numbers enclosed in brackets, either "squared-off" as shown above, or rounded like: (x, y). If the domain of a function does not include endpoints, for example, if the domain of a function ran from 0 to 5, but did not actually include the numbers 0 and 5, interval notation of the representation of the domain would look like: (0, 5). This is the domain of the function, not a coordinate that you would plot on the graph.
There are two things to remember here:
(1) Do not confuse interval notation with the coordinates of a function.
(2) When using interval notation, use the brackets, [x, y] if the endpoints are included in the domain, and use the parentheses, (x, y) if the endpoints of the domain are not included.
Why "f(x)" instead of "y"?
The mathematical notation "f(x) =" indicates that whatever is followed by the equal sign is a function. Some people ask why it is necessary to use f(x) instead of y and whether the two notations are the same. For example, can we replace f(x) with y in the equation: f(x) = x + 2? In this instance, we can replace (either mentally or figuratively) f(x) with y. However, most advanced mathematics books use the functional notation when representing a function. Now, if we try to replace y with f(x) where the equation is not a function (for example, a circle), it is not "mathematically legal" to replace y with f(x) since the equation is not a function. Examples of functions versus non-functions are found below in the section, "When is a relation a function?"
Evaluating f(x)
As we have seen, one of the major aspects of learning functions is to be able to evaluate the functions for certain inputs. For example, if our function is f(x) = 2x + 7, and we want to determine what our answer would be when substituting 4 in for x, we would just substitute the 4 in for x in the equation and simplify the right-hand side of the equation. So, we would obtain, on the right-hand-side, 2(4) + 7 = 15. Instead of a long explanation which explains that the objective is to substitute 4 in for x, a simple way to show that the goal is to substitute 4 in for x is to simply write, if f(x) = 2x + 7, find f(4). Here, instead of the x in the right-hand side of the equation, we substituted 4, which indicates that we must substitute 4 in for x on the left-hand side of the equation. Don't confuse the mathematical notation f(4) with an actual calculation. The notation f(4) simply means substitute 4 in for x, and that is all! So, if the question stated if f(x) = 2x + 7, find f(4), you would substitute 4 in for x on the right-hand side of the equation, obtaining f(4) = 2(4) + 7, so f(4) = 8 + 7, and f(4) = 15.
What about f(1)?
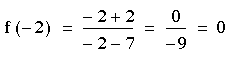
What about f(-2)?
Click here for the answers to f(1) and f(-2).
Linear Functions
If you look back to the table we constructed for the amount paid for 0 through 10 gallons of gasoline, we could plot the corresponding values of x and y on a graph and determine the relationship between the points (draw a line connecting the points). If we did this for our example, the points we would plot on the graph would be: {(0, $0.00), (1, $0.80), (2, $1.60), (3, $2.40), (4, $3.20), (5, $4.00), (6, $4.80), (7, $5.60), (8, $6.40), (9, $7.20), (10, $8.00)}.
Now, if we graphed the line that passes through each of those points, we would obtain a graph as depicted below. In this example, note that the domain is [0, 10] and the range is [$0.00, $8.00]. Based on the graph below, how much would 7 1/2 gallons of gasolione cost? , Approximately how many gallons of gasoline could you buy for $6.50? Click here for the answers.
Another Example:
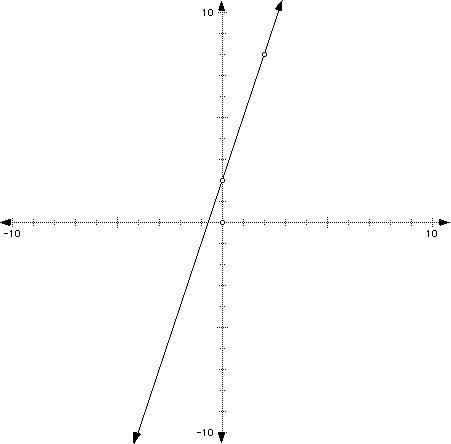
Now let's graph the function f(x) = x + 2. Are there any restrictions
on what we can substitute for x? Well, if you think about this,
no matter what real number you substitute in for x, you'll get
number. Infact, as a review, for every number you substitute in
for x, you'll get a unique value for y, so our equation is a function.
The bottom line is that there are no restrictions on the values
that we can substitute in for x, so our domain runs from negative
infinity to infinity, ![]() . Also, since this is a linear
function, which we can determine once we graph it, we can tell
that the range is also
. Also, since this is a linear
function, which we can determine once we graph it, we can tell
that the range is also ![]() . This domain and range is
characteristic of all linear functions where no restrictions are
imposed in either the domain or the range.
. This domain and range is
characteristic of all linear functions where no restrictions are
imposed in either the domain or the range.
Restrictions on the Domain and Range
The Domain
Until now, we have been able to substitute any value in for
x and obtain an answer. What happens if we try to substitute 2
in for the equation ![]() ? We would get
? We would get![]() which
is not a real number because no number times itself yields a -5.
Try taking the square root of -5 on your calculator. If you do,
you will get an error. This is because
which
is not a real number because no number times itself yields a -5.
Try taking the square root of -5 on your calculator. If you do,
you will get an error. This is because ![]() is not
a real number. So, we must only pick numbers for the domain, that
when we substitute them in for x, give us real numbers. For this
example, we must only use numbers that are greater-than-or-equal-to
7 here, as numbers in that domain will give us positive numbers
under the radical. We may use 7, because if we substitute 7 in
for x, we'll get zero under the radical sign and that's o.k. because
the square root of 0 is 0.
is not
a real number. So, we must only pick numbers for the domain, that
when we substitute them in for x, give us real numbers. For this
example, we must only use numbers that are greater-than-or-equal-to
7 here, as numbers in that domain will give us positive numbers
under the radical. We may use 7, because if we substitute 7 in
for x, we'll get zero under the radical sign and that's o.k. because
the square root of 0 is 0.
Another Example
What about the domain of ![]() ? Here, the denominator
is x - 7, and we know that if a zero appears in the denominator
all by itself, that any number divided by zero is an undefined
number. In short, it is undetermined how many times zero divides
a number, so a fraction cannot have zero as a denominator. For
our example, we can choose any number for our domain except 7,
because 7 will make the denominator equal to zero, which is mathematically
incalculable.
? Here, the denominator
is x - 7, and we know that if a zero appears in the denominator
all by itself, that any number divided by zero is an undefined
number. In short, it is undetermined how many times zero divides
a number, so a fraction cannot have zero as a denominator. For
our example, we can choose any number for our domain except 7,
because 7 will make the denominator equal to zero, which is mathematically
incalculable.
Note that the numerator can equal zero, because a number (other than 0) divides zero, zero times. So, zero divided by any number x (as long as x does not equal zero) is zero. For example, if we substitute -2 in for x in our equation, we would get:
So our domain can be written in interval notation as ![]() . Note the parentheses because 7 cannot be included
in the domain. Why do you think there are parentheses (instead
of squared-off bracket) associated with negative infinity and
infinity? You can also write this domain in set-builder notation
as {x | x < 7 and x > 7}.
. Note the parentheses because 7 cannot be included
in the domain. Why do you think there are parentheses (instead
of squared-off bracket) associated with negative infinity and
infinity? You can also write this domain in set-builder notation
as {x | x < 7 and x > 7}.
For now, square roots and rational expressions that have the potential to have zero in the denominator are our only restrictions on the domain of a function. Note that the function f(x) = x/2 is defined for all values of x because the denominator can never be zero, as it is always 2! So, just because a function has a fraction does not always mean that there are restrictions on the domain.
The Range
Restrictions on the range are usually found a little differently
than restrictions on the domain. All possible numbers that you
substitute in the function may yield only selected answers. For
instance, if the function is f(x) = x2, no matter what
number you substitute in for x, your answer will always be positive.
So, for the function f(x) = x2, the range is ![]() . Since the range includes 0, we use a closed bracket
with interval notation. As a note, the range of all linear functions
(except vertical lines) spans the entire graph. So, the range
is
. Since the range includes 0, we use a closed bracket
with interval notation. As a note, the range of all linear functions
(except vertical lines) spans the entire graph. So, the range
is ![]() for all linear functions.
for all linear functions.
By Definition
We expound upon our definition of a function in the following sections. Functions are special relationships. First, the value of one variable depends on the value of the other as we saw in the above example. Additionally, a relation is a function if there is only one "answer" to every input. For instance, if in the example above we determined that if gas cost 80 cents per gallon and we calculated that 10 gallons of gasoline would cost either $8.00 or $8.50, we would have two answers to only one input. So, for a relation to be a function, for every input into our question, we must only obtain one answer (output). As stated previosly, when graphing a function, the graph of all straight lines except vertical lines are functions.
By Pictorial or Mapping Representations
There are several ways to determine if the graph of a relation is a function. The first way is to pictorially determine if a graph is a function, by mapping all of the elements in the domain to each element in the range.
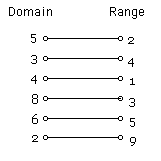
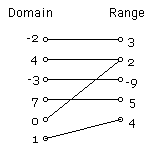
Example 1: Let's say that our domain is {5, 3, 4, 8, 6, 2} and our range is {2, 4, 1, 3, 5, 9} and each member in the domain corresponds with each member in the range, respectively. Now write them as the picture below illustrates. Notice that every member in the domain corresponds to only one member in the range.
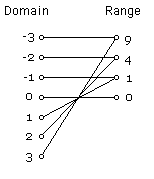
Example 2: Now let's map the domain of {-2, 4, -3, 7, 0, 1} to the range of {3, 2, -9, 5, 2, 4}. If a number appears more than once in either the domain or the range, as 2 appears in the range twice in this example, only write it once in the actual mapping picture.
Here, every element in the domain maps to only one element in the range, so the relation is a function. What about the fact that both 4 and 0 in the domain map to 2 in the range? This example still satisfies the definition of the function because every element in the domain only maps to one element in range. So, two elements is the domain going to one element in the range is "mathematically legal" in a functional sense. We'll come back to this example in the "Vertical Line Test" section below.
Example 3: Let's map domain {2, -4, 0, -5, 6, -4} to the range {1, 2, 3, 7, -9, 4}. Here, one element in the domain maps to more than one element in the range. Specifically, -4 maps to both 2 and 4, so by definition, the relation is not a function.
Two summarize, a function may have two different variables of the domain that map to one variable in the range, but a relation is not a function if two lines emanate from one variable in the domain to two variables in the range.
The Vertical Line Test
Consider the equation y = x2 in the interval [-3, 3]. Let's substitute some values in for x, determine y, and map the domain to the range like we just did in the section above. Let's use the set {-3, -2, -1, 0, 1, 2, 3} for the domain. If we substitute each of the values in the domain in for x in our equation, our equation tells us to square each value. So, we'll get the range: {9, 4, 1, 0, 1, 4, 9}. Now, map the domain to the range as shown below.
Here again, every element in the domain maps to only one element in the range, so the relation is a function. Since we already know that this graph is a function, there must be some characteristic about the graph itself that determines that it is a function.
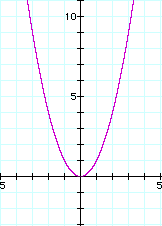
The function, f(x) = x2 is pictured below. In a later section, you will learn how to graph this type of function. On the graph below, you can determine the definition of a function (if each value of x determines one and only one value of y) just by looking at the graph. For each value of x there is only on value for y. To determine this, start at the origin and move left or right across the x-axis. After moving to any value of x, you can only go up or down on the y-axis to get the the graph. So, for every value you pick for x, you only have one choice to pick from (up or down... or staying at 0 if you are at the origin) to get to the graph. That means that for every x there is only one corresponding value for y. Similarly, for every element in the domain, there is only one corresponding value in the range. Thus, our equation is a function!
The Vertical Line Test
Graphically, as simple way to determine if a relation is a function is to use the Vertical Line Test. The Vertical Line Test states that a relation is a function if, when you draw a vertical line through any part of the graph, the vertical line touches or crosses the graph only once.
Notice that if we drew a vertical line through any part of the graph f(x) = x2 , the vertical line would touch the graph only once. Make sure that when you are using the Vertical Line Test that you draw the vertical line, at least mentally, through all possible points on the graph. For instance, the vertical line may intersect a graph at only one point on certain parts of a graph, but may intersect it at more than one point at other parts of the graph. The rule of the Vertical Line Test states that if the vertical line crosses the graph at more than one point ANYWHERE ON THE GRAPH, the graph is not a function. Note that a circle is not a function.
Is a vertical line a function? Why or why not? Think about this and then click here for the explanation.