
Problem 1 is an exploration of the function below for different values of n.
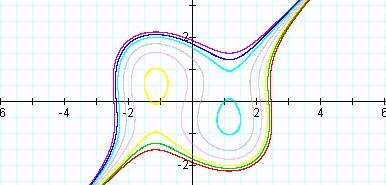
In the first set of graphs n is replaced by 5,3,2,1,1.1,0.9,and-3.This is the resulting graph.
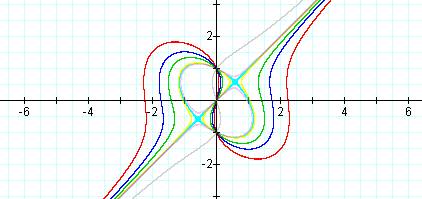
In first three graphs n=5,n=3, and n=2, the graphs have the same shape. The shape is a curved one that has two curves that go up and down then goes on indefinitely on each end. The graph where n=5 is red and is the largest one. The other two graphs are blue and green, respectively, and each one has the same shape as the first. Each graph is smaller than the one before it.
When you get to the fourth graph where n=1, this is the light blue one, the graph changes shape. The graph is made up of an elliptical shape that has a linear path that goes right through the center of the ellipse. The next graph, where n=1.1, is yellow. This graph seems to trace the previous graph, but does not have the exact same elliptical shape. This graph also continues on in a linear path that continues on indefinitely. The next graph, where n=0.9, is pink. This graph also traces the graph where n=1. This graph traces almost on the inside of the graph where n=1, where the previous graph traced mostly on the outside of the graph.
The last graph, where n=-3, changes shape once again. This is the gray one. This graph goes along the y-axis, where the others seemed to go along the y-axis. This shape is also more flattened out than the others. It also has two curves in the graph like the first three and goes on indefinitely after the curves in opposite directions.
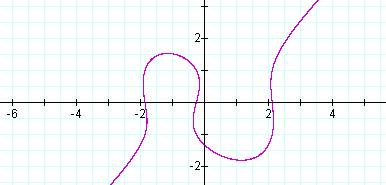
The next part of problem 1 asks for an equation for a given graph.
The equation that I found to give the closest graph to the given one is
In this set of graphs, I added constants to each side of the equation to test what would happen. First, I added 5, 4, 3, and -1 on the left.
This is the resulting graph of the equations.
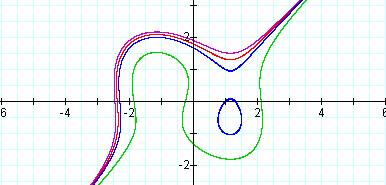
These graphs are also curved, like the original set of graphs, but they have different shapes. The first graph is the purple one where the constant 5 is added. This graph has only one curve and then goes on forever in both directions. The next graph, where the constant 4 is added, is the red graph. This graph has the same shape as the purple one, but it is smaller. The third graph, where 3 is added, is the blue graph. This graph has a more pointed curve and had also added a circular shape onto it. The last graph, where ñ1 is added, is the green one. This graph has two curves on it and then goes on forever in both directions.
In the next set of graphs, I added the constants 5,4,3, and ñ1 onto the right side of the equation.
These were the graphs resulting from adding the constants on the right.
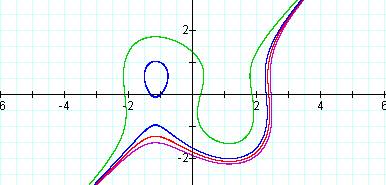
These graphs are basically the same as the graphs in the previous example, but they have been flipped onto the opposite side of the axis. Each graph has the same color as the one in the previous example for the same constant. So, you can tell by looking at both graphs that they are the exact same shape.
Therefore, I suggest that adding the same constant onto the left or the right side of the equation will result in the same shape but on opposite sides of the axis.
The last graph that I made on this set of problems has both sets of equations on it. This graph includes the graphs where the constants are added on the left and the right.
You can definitely tell from this graph how the shapes are the same but on opposite sides of the axis. The ones on the top left are the ones where the constant is added on the left.The ones on the bottom right are the ones where the constant is added on the right.
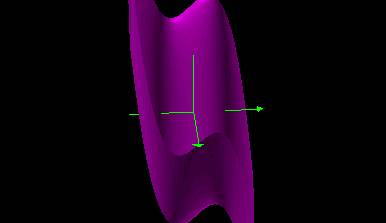
The resulting graph is a three dimensional graph. This graph is also curved like all of the other graphs of the function.