
The spirals described on shells, and called concho-spirals, are such as would result from winding plane logarithmic spirals on cones.Henry Moseley (1801-1872)

Then each point P can be located by assigning to it a polar coordinate
pair (r, ø), in which the first number, r, gives the directed distance
from O to P and the second number, ø, gives the directed angle from
the initial ray to the segment OP:

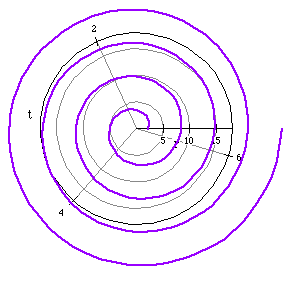
is an example of a Spiral of Archimedes.
First, let a=0.1. So we get the equation r = 0.1t and its graph:

The graph represents that of a spiral.
Let a become smaller and tend to zero.
For example, when a=0.01, we get r=0.01t and its associated graph is also
a spiral.

For the polar equation r = at where a tends to be small,
the graph represents that of a spiral. As a becomes smaller and tends
to zero, the graph continues to become a tighter, more compressed spiral.
If we let a=0.00001 and magnify the graph of r = 0.00001, the graph still
represents a spiral.

We can classify any polar equation that has the form
where a>0 as a hyperbolic spiral.
We want to explore this polar equation as a grows larger.
We let a=.5, 1, 4, 10, 25 and graph each associated polar equation.
a=.5 (blue)
a= 1 (red)
a= 4 (green)
a=10 (orange)
a=25 (purple)

As a grows larger, the spiral becomes larger and r is greater.
In general, logarithmic spirals have equations in the form
The distance between successive coils of a logarithmic spiral is not
constant as with the spirals of Archimedes.
For example, the graph of
is a logarithmic spiral. Notice the distance between the successive coils
is greater as the spiral grows.
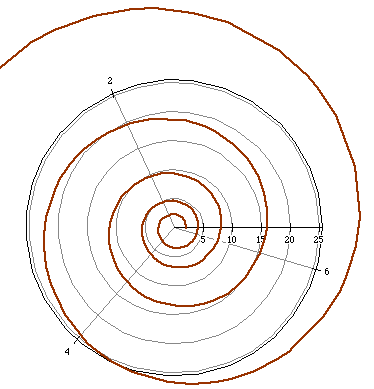
In nature, you may have noticed that shells of some sea creatures are shaped
like logarithmic spirals particularly the nautilus.
Click here
for more information regarding logarithmic spirals particularly the chambered
nautilus.
More specifically, consider the following example of a logarithmic spiral.
The following graph represents logarithmic spirals for a=1, 3, 10, 17,
and 32.
a=1 (cyan)
a=3 (purple)
a=10 (red)
a=17 (blue)
a=32 (green)

Notice as a grows larger, the spiral becomes tighter and smaller. In addition, each spiral originates from the same point.

where a and b are nonzero real numbers.
There are four basic shapes. The following graphs show examples of
each type of limacon.

Notice the change from cos to sin rotates the limacon 90 degrees in the
clockwise direction.
What if we change the positive sign to a negative sign and make a
smaller?

Changing the positive sign to a negative sign has the effect of reflecting
the limacon and producing a mirror image of itself. The other change, making
a smaller, creates a larger inner loop.
Lastly, we want to explore what happens as b grows larger.
The graphs for the following polar equations are shown.
r=1/4+2*cos(t) (purple)
r=1/4+4*cos(t) (green)
r=1/4+6*cos(t) (pink)

As b grows larger, the limacon also gets bigger. Furthermore,
the reverse holds. As b decreases, the limacon gets smaller.

The dimpled limacons have the shape of an apple. The change from positive
to negative has the same effect as in the previous graphs.
The following polar equations and their graphs are examples of convex
limacons.
r=2+cos(t) (blue)
r=-2+sin(t) (magenta)

The graph seems to flatten on one side of the limacon.

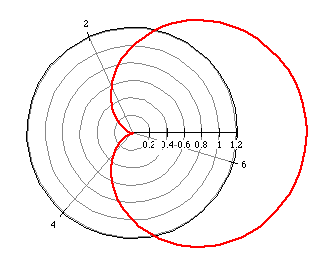
Changing the +1 to a -1 had no effect on the graph of the cardiod. This
is true for the other types of limacons. Hence, changing a to its
opposite has no effect on the graph of a limacon.
Changing + b to - b has the same effect on the cardiod as
with the other limacons; that is a reflection occurs.
For example, the following polar equations are reflections or mirror images
of each other.
r=1+cos(t) (magenta)
r=1- cos(t) (purple)

What do we have to change to make our cardiod larger or smaller?
Hint: note the relationship between a and b.
With further investigation and exploration of various a and b,
we discover that if |a| = |b|, the cardiod will increase or decrease
in size depending on the value of a and b.
Try graphing these polar equations to test our assumption.
r=0.5+0.5*cos(t) (black)
r=2+2*cos(t) (purple)
r=3+3*cos(t) (red)
r=4+4*cos(t) (blue)
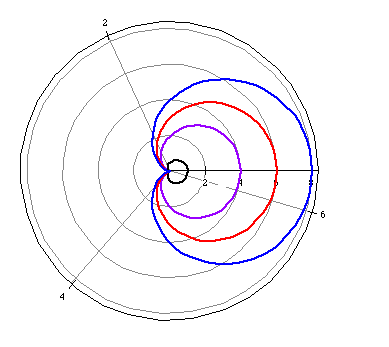
As |a| increases the size of the cardioid increases. Similarly, as |b| decreases the size of the cardioid gets smaller.
Consider the following polar equations
r = cos (2 t) (light red)
r = 3 cos (2 t) (heavy red)
and their associated graphs.
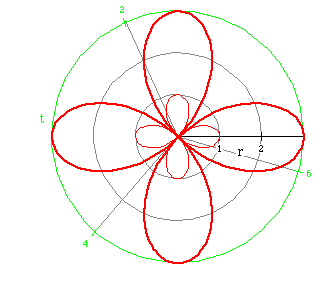
What is the effect of a and n on the graph?
Consider several more examples.
r = 2 cos (4 t) (purple)
r = 3 cos (6 t) (red)
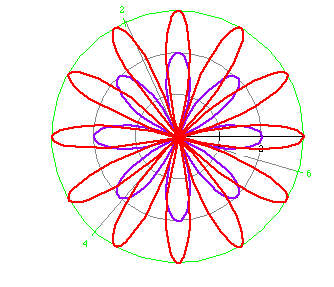
What did you notice?
First, a determines the length of each petal. For example, the polar
graph of the equation
is rose with petal length of 5. What does the 8 in the equation do?
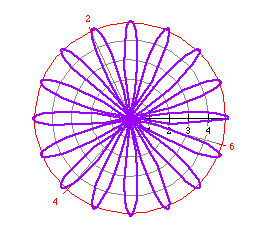
By now, you should realize that the number of leaves is determined by
n. How?
From our previous examples, the number of leaves is twice n
when n is even. Does this always hold true?
Try these other examples to investigate this assumption.
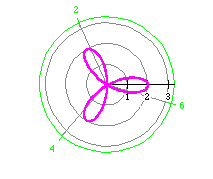
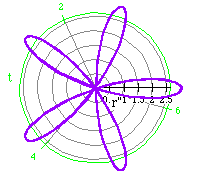
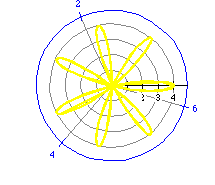
Our original assumption, the number of petals is 2n, does not
hold true when n is odd. We can make a new generalization, however,
that does hold true. There is a difference between the number of rose petals
when n is odd and even. When n is odd, the number of petals
is n. When n is even, the number of rose petals is 2n.
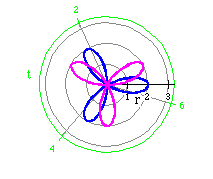
What if we change cos to sin? Does the polar graph still represent a rose
curve? What effect does this change have on the polar graph?
Try graphing several of these polar equations.
r = 2 cos (3 t) (blue)
r = 2 sin (3 t) (purple)
r = 3 cos (4 t) (purple)
r = 3 sin (4 t) (red)
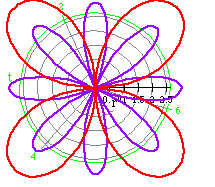
r = 4 cos (5 t) (purple)
r = 4 sin (5 t) (green)
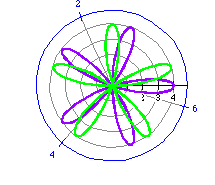
Obviously, sin or cos can be interchanged and the polar graph still represents
that of a rose. Changing cos to sin, however, does rotate the rose.
Based on our observations, what generalizations can we draw about rose
curves?
In general, rose curves have equations of the form
where a>0 and n is a positive integer.
The length of each petal is a.
The number of leaves is determined by n.
If n is even, there are 2n petals.
If n is odd, there are n petals.
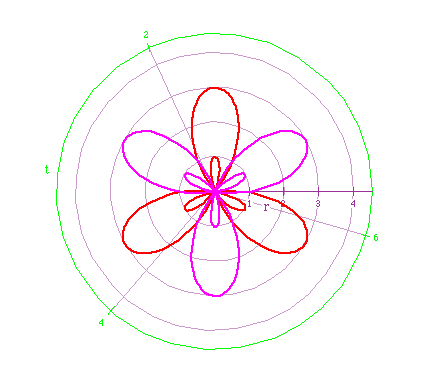
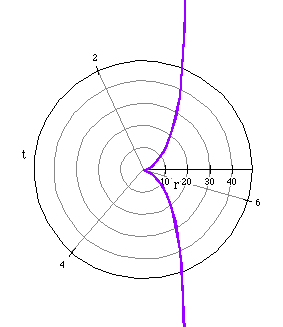
A vertical asymptote occurs at x=2a.
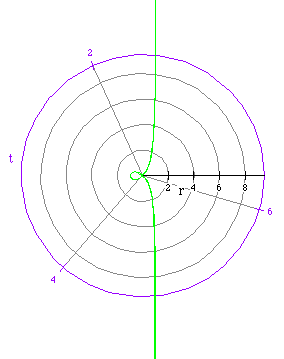
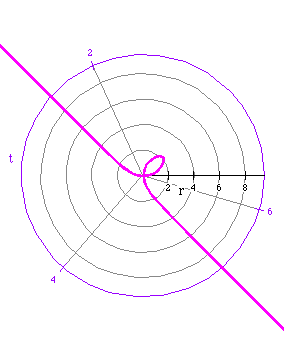

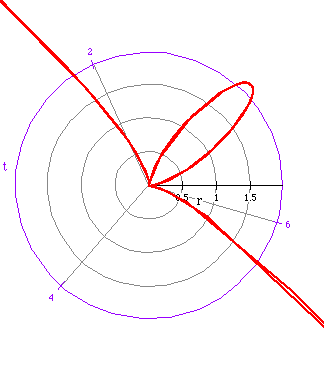
The last three polar graphs are similar to each other.