Exploration of y = a sin(bx + c) and the use of "Algebra Xpresser"
by Kyungsoon Jeon
Our society is changing rapidly and I believe classrooms also have to change not only to catch up with our developing society but also to lead it in front. This class is for familiarizing students with " Algebra Xpresser " and teaching them the role of a, b, c of
y = a sin ( bx + c ). Student should be continually challenged to consider "What if " extensions in their problem explorations. I suppose that students already know the meaning of amplitude, frequency , maximum, minimum of a function and its translation.
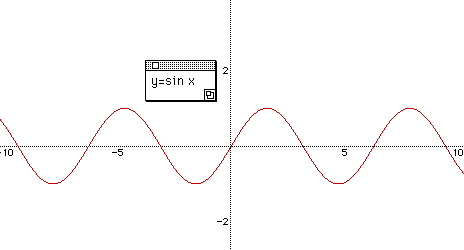
Write a function y = sin x on the black board. Ask students the basic knowledge of y = sin x. For example, "What is the domain of it? " , "What's the range of it? " " what does it look like? ", " what is the amplitude? " and " what's the frequency? ".
Then graph it together by using algebra express.

What is the first x intercept ? Since algebra xpresser can show the coordinates of a graph we need to check the points where the graph and x-axis meet.
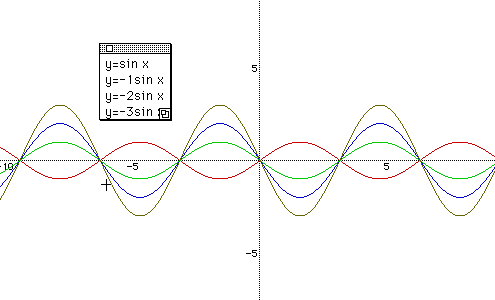
After checking that students have a good knowledge of the function, give a question "What if we put 3 in front of sin x, that is y = 3 sin x?" There might be various answers.
Discuss why they guessed the way they did. Then graph it again in the same plane with Fig 1 so that students can see the changes of maximum and minimum values of the function.
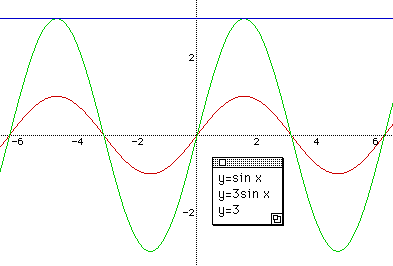
At this point, students can know that algebraic xpresser can be used to see the changes
of variables very easily than the conventional way of seeing the teacher drawing each function.
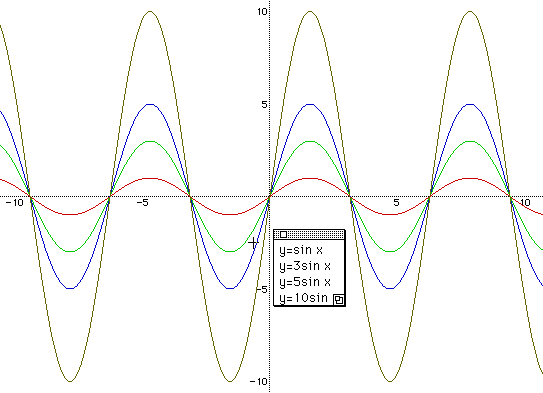
Continue to ask "What if we put 5, 10,...?" Check the graph according to the changes of numbers. Now students are certain that as the number increase, so does the amplitude.
Give another question like this "What if we put -1 in front of sin x, that is y=-sin x?" Have students go to the answer by themselves, develop their own mind, then go to the graph of it.
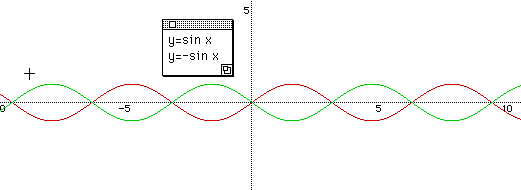
Check with the students that y=-sin x is the reflection about the x - axis of y = sin x. "Does the amplitude change? " Keep on going to the question. " What if -2,-3,-4...?" Here, students can understand that the absolute value of a gives an effect of the amplitude of each function, and the larger the value is, the bigger amplitude we have.
Now, let's go on to b of y= a sin ( bx + c ). To see the role of b clearly and explicitly, fix a = 1 , c = 0. Ask students "what is the frequency of y = sin x ? " again. After listening to their answer, give another question. "What if we put 2 in front of x, that is y = sin 2x ? "
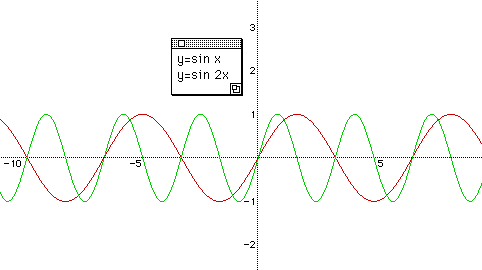
As we see on the graph, y = sin 2x moves two times while y = sin x shows one
change in a shape. That is to say, b changes the frequency of a function. Have
student guess the graph of y = sin
 x.
x.
In particular, we are interested in analyzing these two graphs y= sin 2x, and y
= sin
 x
x
in comparison with y = sinx.
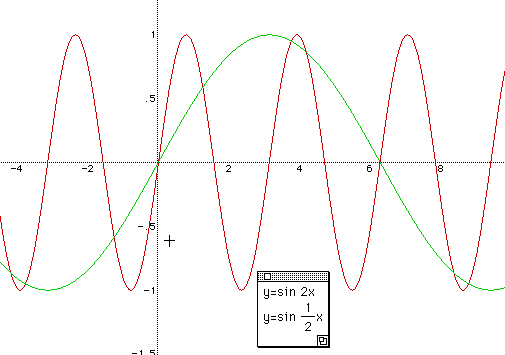
Now, students can have the idea of the roll of b clearly. As b becomes bigger,
the frequency becomes lesser. The frequency of y = sin x is 2
 ,
that of y = sin 2x is
 and that of y = sin
 x
is 4
 .
.
Let's summarize the fact. For a given function y = a sin bx , the frequency is 2
 /
| b | .
Let's compare y = sin
 x
and y = 2 sin
 x.
Is there a change of frequency?

The maximum of it is | a | , and the minimum of it is - | a | in y = a sin bx. The value of a in y = a sin bx is not related with the frequency of a function. It just changes the maximum and minimum of it. Before talking about the changes of c and its effect, let's have students conjecture two quadratic functions, y = x 2 and y = ( x - 2 ) 2 .
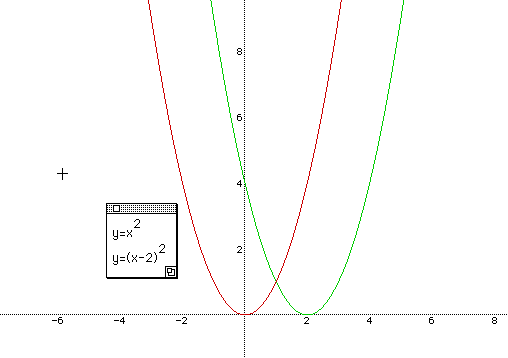
It's for understanding the idea of a horizontal translation of functions by some units. We know that y = ( x - 2 ) 2 is a horizontal translation of y = x 2 r right 2 units.
Now take c as 2, then y = sin ( x - 2 ). We can observe that the graph of y = sin x moves to the positive direction of x - axis by 2.
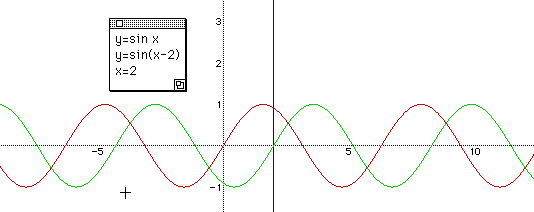
"What if c is
 ( about 3.14 ) ?" or "what if c is 2
 ( 2 * 3.14 ) ?" Since the frequency of y = sin x is 2
 ,
we can understand that the two graphs are the same in shape and are certain
that why it is. If students feel comfortable with the graphs of trigonometric
functions, give them a question that they can move the graph of y = sin x to
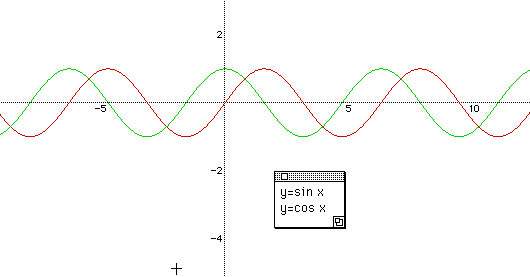
fit with y = cos x.
" What is b? "
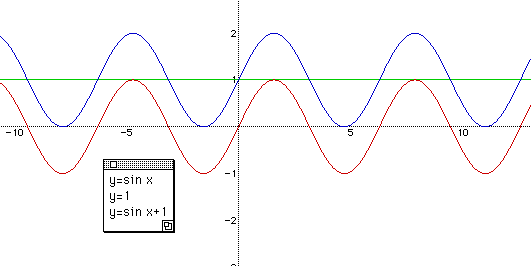
Further more, we can give a more complex question with respect to the maximum and minimum of a sign function. " What is the maximum of y = sin x + 1 ? " We can think this graph in a view point of the sum of two functions like y = sin x and y = 1.
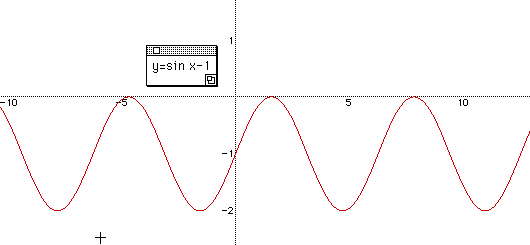
Once checking that students can understand this process. Give them another question,
" What if the minimum of y = sin x - 1 ? "
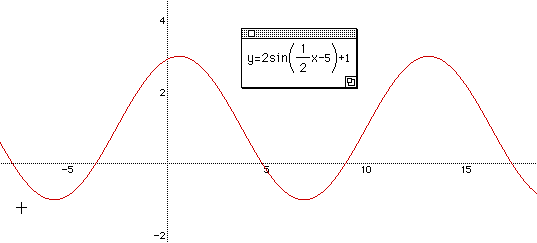
For a deeper understanding of relationship of a, b, c, we can give them a function
y = 2 sin (
 x
- 5 ) + 1 to get the maximum and minimum, frequency, and amplitude.
Check the results with students by graphing the function.
I believe teachers can make a classroom into a place for exploring and enhancing the scope of thinking by encouraging students to graph themselves rather than placing excessive emphasis on conventional drawing of functions by teachers. Now, it is time for teachers to prepare " how they teach mathematics" as well as "What students have to learn about it." .