Assignment ten for EMT 668 ends with problem twelve. It states, "A cycloid is the
locus of a point on a circle that rolls along a line. Write parametric equations
for the cycloid and graph it. Consider also a GSP construction of the cycloid".
Sounds intriging and a topic full of possibilities.
By perusing the enrichment material for Merril Advanced Mathematical Concepts
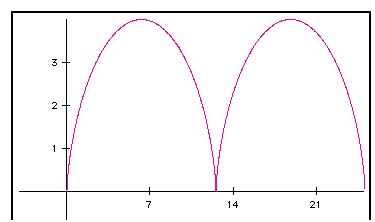
I find the parametric equations for the cycloid:

When the values of a
and b
change the cusp of the curve becomes a loop if a
<b
. If a
>b
the curve does not intersect the x axis. The graph of the equations
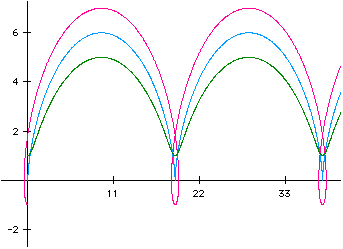
Compare that graph with the pink and the green graphs. The pink graph results from
the equations x=3t-4sin(t)
and y=3-4cos(t)
. The green shows the result of graphing the equations with a=3
and b=2
.

In each case the graph repeats on an interval along the x axis that is (2pi)(a) units
in length. This follows because of the periodic nature of the sin(t) and cos(t).
For this particular set of graphs the interval is seen approximately every 18.85
units. The graph of the equations will first reach its peak value for y when the parameter
t = (pi/2). With cos(pi/2)=-1, the value of y becomes (a+b)
. In the graphs above these peaks are y=5, y=6 and y=7.
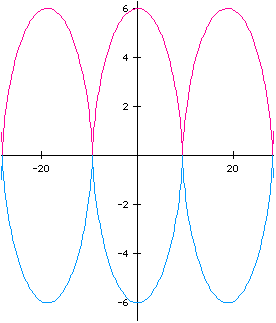
Some variations of this theme take place when the signs of a
and b
change. With one positive and one negative value the graph peaks when t=0. When a
is negative the graph lies below the x axis. The following graphs illustrate these
generalizations. The equations graphed are

In Holt Calculus
authors Robert Ellis and Denny Gulick describe the cycloid
as ,"perhaps the most famous curve described parametrically". I feel pleased to have
spent time with this, perhaps, most famous of curves.
To illustrate the cycloid dynamically I use Geometer's Sketchpad and ,with help from Dr. Jim Wilson, am able to show a circle rolling along a line. A point on the circle is traced and the locus is indeed a cycloid. Click here to see the file cycloid.gsp.See sketchpad demo
In class one evening in the winter of 1996 Dr. Wilson asks, "Why does the circle have
to roll along a line?" Why, indeed! As my investigation continues I find cycloid
mean "wheel" in Greek and hypocycloid means "under the wheel" and epicycloid means
"upon the wheel". (Holt Calculus,
1995).
Back to Geometer's Sketchpad I go, trying to trace out one or both of these
critters. I experience difficulty with my wheel rotating in the proper direction
but, eventually, succeed in creating the hypocycloid. Click here to see the hypocycloid
demonstration. See Sketchpad demo. The shape of the curve depends on the ratio of the radius of the rolling
circle to the radius of the stationary circle. When the rolling circle's radius
is one fourth that of the stationary circle the curve has four cusps and is therefore
called a hypocycloid of four cusps, or an astroid. Experiment with the length of the
radii by dragging the specified points in the GSP demonstration to view the astroid.
As is always the case with the explorations I feel I'm just getting a glimpse of all there is to know about these "oids"...Its been lots of fun making their acquaintance and I look forward to getting to know them better.