Assignment 3: Further Exploration of Parabolas
by Kristina Dunbar, UGA
In Assignment 2, we explored the graphs of the equation y = ax2 + bx + c while varying the values of a, b, and c one at a time. In this assignment, we will be exploring roots of this equation. For simplicity, we will let a = 1 and c = 1 and vary the value of b.
![]()
Let's consider the equation
x2 + bx + 1 = 0
![]()
First, we'll graph the equation in the xb-plane:
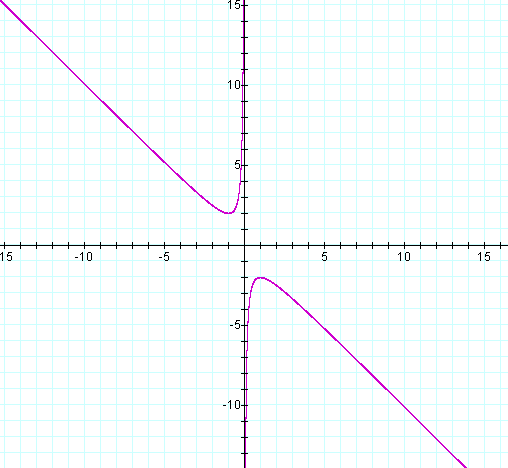
We notice that there are no solutions to this equation when -2 < b < 2. We also notice that if b equals 2 or -2, there is exactly one solution to the equation, and that when b < -2 or b > 2, there are two solutions. Here are some further examples:
Let's consider the same equation now, but overlay different values of b.
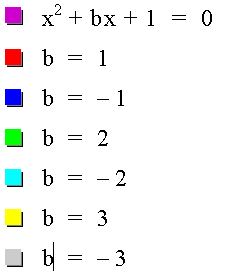
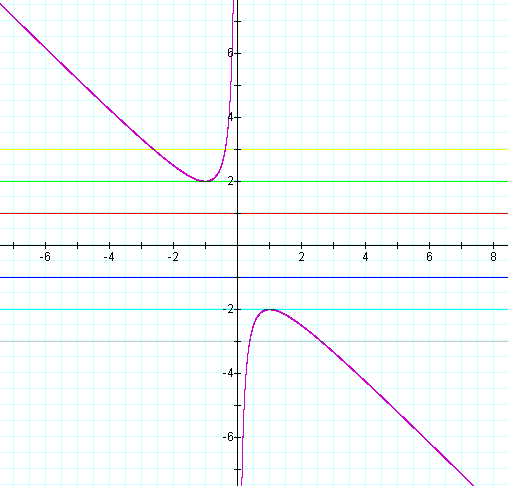
It is very clear by looking at these graphs that there are no solutions to the equation x2 + bx + 1 = 0 when b is between -2 and 2.
![]()
We can look at the same information graphically in a different way, by looking at the parabolas for the equation y = x2 + bx + 1.
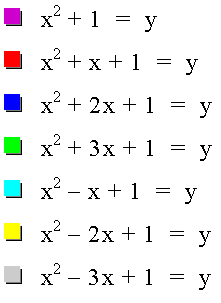
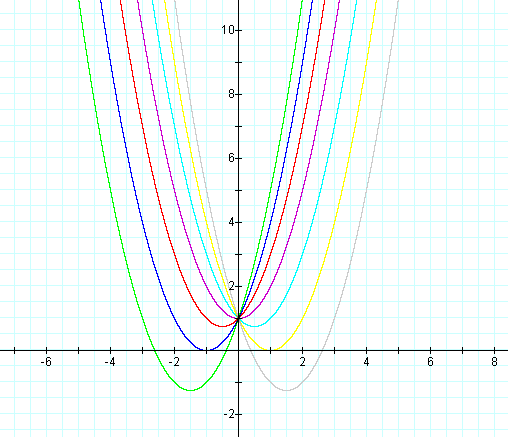
The graph has roots where the parabola crosses the x-axis.
We see that the graph does not cross the x-axis when b is between -2 and 2, which means that it has no real roots.
When b = 2 or b = -2, the parabola touches the x-axis in exactly one point, thus the equation has one real root when b = 2 or b = -2.
When b < -3 or b > 3, we see that the parabola crosses the x-axis in two locations, so the equation has two real roots.
You might also notice that when b > 3, the equation has two negative roots, but when b < -3, the equation has two positive roots.
There is one other investigation we can do with the above graph. Let's graph the vertices of all of the above parabolas.

Notice that this parabola satisfies the equation y = -x2 + 1.
![]()
How do the graphs of these parabolas tie in to what we know about quadratic equations?
Let's consider the general solution to the equation y = ax2 + bx + c.

The portion of the equation
![]()
is considered the discriminant, and the quantity under the square root symbol must be greater than or equal to zero to get real roots.
For a = 1 and c = 1, then b2 must be greater than or equal to 4 to get real solutions.
Because b2 must be greater than or equal to 4, then b must be greater than or equal to 2.
This algebraic solution agrees with the visual solutions we found by looking at the graph.
![]()
Return to my Home Page.
Return to TOP.