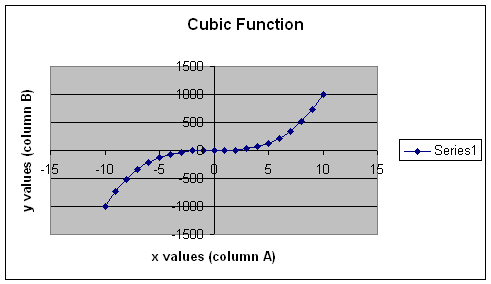
Construct a graph of any
function y = f(x) by generating a table of values with the x values in one
column and the y values in another.
The function I chose to construct is y = x^3. The x values are in column A and the y values are in column B. A copy of the data and the graph are below. Click here in order to see the file in excel. Enter x values and the program will automatically enter the y value.
| -10 | -10 |
| -9 | -9 |
| -8 | -8 |
| -7 | -7 |
| -6 | -6 |
| -5 | -5 |
| -4 | -4 |
| -3 | -3 |
| -2 | -2 |
| -1 | -1 |
| 0 | 0 |
| 1 | 1 |
| 2 | 2 |
| 3 | 3 |
| 4 | 4 |
| 5 | 5 |
| 6 | 6 |
| 7 | 7 |
| 8 | 8 |
| 9 | 9 |
| 10 | 10 |
