Assignment 12
This activity focuses on using
spreadsheets, such as Microsoft Excel, to explore mathematical concepts
such as Fibonacci sequences.
To use Excel to generate a
Fibonacci sequence start with the number 1 in block A2, and the number
1 in block A3.
To create a formula that will generate a list of n Fibonacci numbers,
click on cell A4 and enter [=A2+A3] in the formula bar. Then
highlight cell A4, copy, and paste into n-2 additional blocks in column
A.
Click on cell A30 to check the
formula. In the formula bar, [=A28+A29] appears, so our formula
works.
Next let's look at the ratio
between each pair of adjacent Fibonacci numbers. In cell B3, type
[=A3/A2]. Copy and paste this formula into the rest of the cells
in row B, just like we did for the Fibonacci. Again, check the
formula to be sure it works.
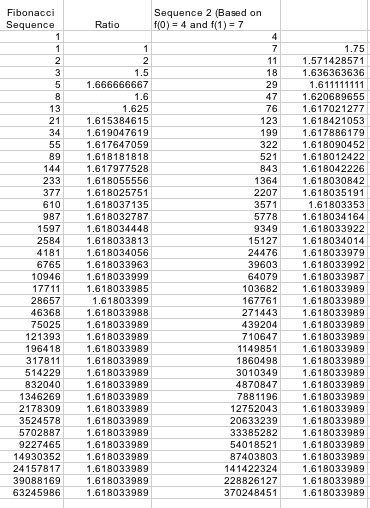
Notice what happens to this ratio
as the pairs of Fibonacci numbers increase in value. As the value
of n increases, the ratio oscillates and settles out at
1.618033989. We can summarize this as follows: As n approaches
infinity, the limit of the ratio of adjacent Fibonacci numbers
approaches 1.618033989.
Now let's consider a different
case. Choose two arbitrary numbers for f(0) and f(1) and observes
what happens to the same ratio. Let f(0) = 4, and f(1) = 7.
The values in the first column are very different from the sequence of
Fibonacci numbers we just created. However, notice the
similarities in the ratios. The limit of both sets of ratios
approach 1.618033989 as n approaches infinity. In fact, sequence
two reaches this limit three numbers earlier than the Fibonacci
sequence.
Finally, let’s consider one more
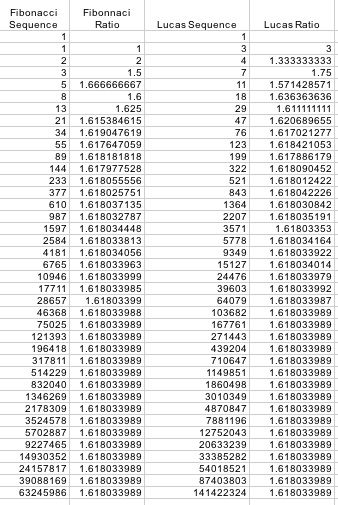
case. Let f(0) = 1 and f(1) = 3. This is referred to as the
Lucas Sequence.
Again, notice the similarities in the ratios. The limit of all
three sets of ratios approach 1.618033989 as n approaches infinity.
Return to my homepage


