
Assignment 3
by
Johnie Forsythe
Let's explore the equation
 To begin our exploration,
we will consider different values of a, b, or c as the other two
are held constant.
Lets begin by exploring
the variable a.
If we set
To begin our exploration,
we will consider different values of a, b, or c as the other two
are held constant.
Lets begin by exploring
the variable a.
If we set  for
a = -3, -2, -1, 0, 1, 2, 3, and overlay the graphs, the
following picture is obtained.
for
a = -3, -2, -1, 0, 1, 2, 3, and overlay the graphs, the
following picture is obtained.

 NOTE: The colored boxes
correspond with the colored parabolas
Observations:
- The parabola always passes
through the same point on the y-axis (point (0,1)).
- The vertex of the parabola
changes in each equation.
- The concavity of the
parabola changes in each equation.
Let's now set
NOTE: The colored boxes
correspond with the colored parabolas
Observations:
- The parabola always passes
through the same point on the y-axis (point (0,1)).
- The vertex of the parabola
changes in each equation.
- The concavity of the
parabola changes in each equation.
Let's now set  for
b = -3, -2, -1, 0, 1, 2, 3, and overlay the graphs. The
following picture is obtained:
for
b = -3, -2, -1, 0, 1, 2, 3, and overlay the graphs. The
following picture is obtained:

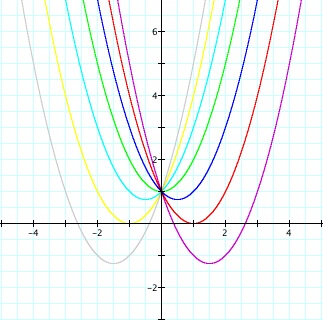 Observations:
- Again, the parabola always
passes through the same point on the y-axis (point (0,1)).
- Again, the vertex of
the parabola changes in each equation.
- However, the concavity
of each parabola seems to have stayed consistently the same.
FInally, let's set
Observations:
- Again, the parabola always
passes through the same point on the y-axis (point (0,1)).
- Again, the vertex of
the parabola changes in each equation.
- However, the concavity
of each parabola seems to have stayed consistently the same.
FInally, let's set  for c = -3, -2, -1, 0, 1, 2, 3, and
overlay the graphs. The following is obtained:
for c = -3, -2, -1, 0, 1, 2, 3, and
overlay the graphs. The following is obtained:

 Observations:
-The parabola does NOT
pass through the same point as c changes.
- The vertex of the parabola
changes in each equation.
- The concavity of the
parabola increases as c increases.
Observations:
-The parabola does NOT
pass through the same point as c changes.
- The vertex of the parabola
changes in each equation.
- The concavity of the
parabola increases as c increases.
Back to
Johnie Forsythe's EMAT 6680 Homepage