
Linear function exploration
By
Jeffrey R. Frye
By taking some linear functions f(x) and g(x), an exploration will be done to see what happens when these functions are combined. The different combinations are listed below:

Let f(x)=x+1 and g(x)=-2x-3. The illustration of the above combinations can be seen below:
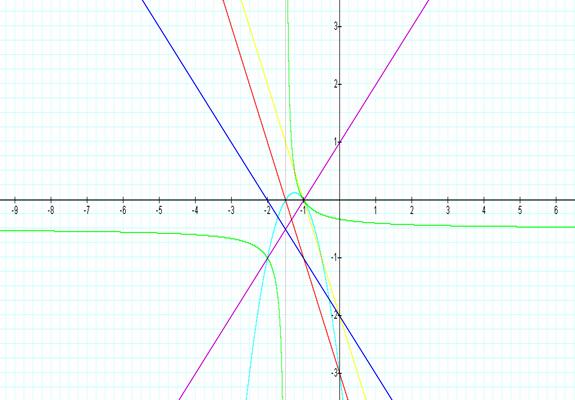
The graphs are color coded.
f(x) is purple.
g(x) is red.
1) is blue.
2)
is turquoise.
3) is green.
4) is yellow.
As can be seen on this illustration, adding the functions
will result in new linear function with a change in slope and y-intercept. Multiplying the functions will result in a
quadratic function that graphs as a parabola.
Dividing the functions will result in an equation that has a graph that
is undefined when the denominator is equal to zero. This value is ![]() and is the vertical asymptote. Since the degree of the numerator and
denominator are the same, there will be one horizontal asymptote. It will be at
and is the vertical asymptote. Since the degree of the numerator and
denominator are the same, there will be one horizontal asymptote. It will be at ![]() and is found by using
the leading coefficients of the numerator and the denominator. By combining the
functions, the result is another linear function.
and is found by using
the leading coefficients of the numerator and the denominator. By combining the
functions, the result is another linear function.
To do your own exploration on Graphing Calculator, click here.
Return to Frye main page.