Stamp Prices: Where have they been
and where will they go?
by Kristy Hawkins
Rumor has it that the price of a first-class stamp
is yet again increasing on January 8th, 2006. The price increase
will be 2 cents making 39 cents the new rate at which Americans
can send a first-class letter.
This data set describes first class letter postage
from 1919 to 2006. Let's explore this data and try to write a
function that will describe it.
| Year |
Rate(in
cents) |
|
|
| 1919 |
2 |
| 1932 |
3 |
| 1958 |
4 |
| 1963 |
5 |
| 1968 |
6 |
| 1971 |
8 |
| 1974 |
10 |
| 1975 |
13 |
| 1978 |
15 |
| 1981 |
20 |
| 1985 |
22 |
| 1988 |
25 |
| 1991 |
29 |
| 1994 |
32 |
| 1997 |
33 |
| 1999 |
34 |
| 2002 |
37 |
| 2006 |
39 |
Here is a scatter plot of our stamp data.
 At first glance, we can see that the data is not linear.
It seems to have begun with a slow increase, and then the rate
of the increase has continuted to rise. This causes me to guess
that this data could be exponential. A quantity that grow exponentially
is one that grows at a rate proportional to it's size. This means
that the larger a quantity gets, the faster it grows. This definitely
seems to describe our data.
So how do we determine which exponential function best
describes our stamp data?
By using Excell, we can find the line of best fit for
our sample data.

 We can see from this chart that our new exponential
function does not fit our data exactly, but pretty close. At some
times the rate increased more rapidly (1978-2002) or less rapidly
(1958-1975), but we will use this function to estimate stamp prices
to come.
 Now we can use our new predicted data to see all kinds
of things. For instance, examine this chart to see when the cost
of a first class postage stamp will reach $1.00. When will the
cost be 64 cents? How soon can we expect the next 3 cent increase?
The answers would be 2028, 2017, and 2007 respectively. Can you
image that someday it might cost a whole dollar to send a letter?
Rumor has it that in 1996, the analysis of stamp data
historically seemed to show that the postage doubled every 10
years approximately. The cost in 2006 would seem to argue that
pattern is no longer valid. Is there evidence to show a change
in the growth pattern? Or, was the 'doubles every ten years' just
a bad model?
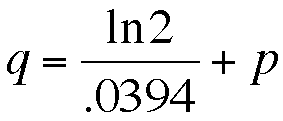
To answer these questions we must examine our exponential
growth equation. Let's say that at some time y the price of stamps
is p. They at 2y the price of stamps is q. We can use these two
equations to find out the doubling time of the price of stamps.


If we multiply our first equation by 2 we get...
 Then we can set the two equations equal to each other


If we take the natural log of both sides...


 This tells us that the price of stamps should double
in about 17 and a half years, which definitely isn't ten years.
I think that 10 years doubling time is just a bad model of stamp
rates.
Return


