
I remember when the cost of stamps went from a quarter to 29 cents. I was irritated because now buying stamps would be more annoying. I would no longer be able to get 4 for a dollar and would need to buy all these silly 1 cent stamps to use up my old stamps. Little did I know, this trend would continue. The post office seems to now change the price of first class stamps every other year. In fact, the price has changed a dozen times in my lifetime.
|
|
|
|
|
|
|
|
|
|
|
|
|
|
|
|
|
|
|
|
|
|
|
|
|
|
|
|
|
|
|
|
|
|
|
|
|
|
|
|
|
|
|
|
|
One way to try to predict what will happen in the future with the cost of stamps is to use a spreadsheet, plot the data, and develop a prediction function. So I put this information into EXCEL and used the chart command and trendline to get a linear prediction.
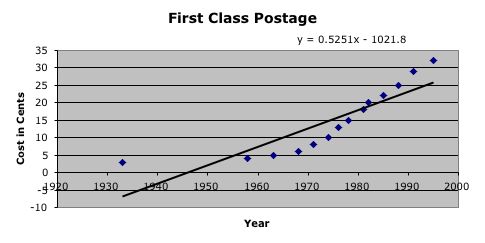
Using this equation, I could predict that stamps would cost $1.00 in 2136 and $0.64 in 2067. Furthermore, the next 3 cent increase wouldn't happen until 2012. Well, we all know that stamps are already $0.37, so this prediction function really isn't that good. It seemed to me that the initial value in 1933 was causing the entire prediction function to get off track, so I decided to not abandon the linear prediction, but instead only look at it from 1958 to 1995.
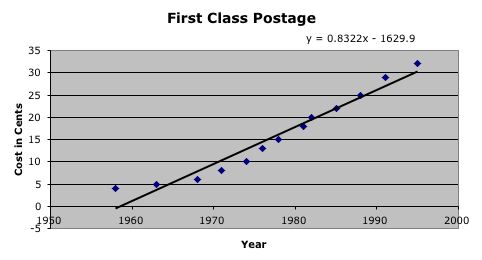
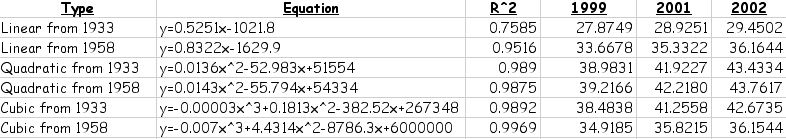
With this equation I see that stamps would be $1.00 in 2078, $0.64 in 2035, and $0.35 in 2000. Now this is a bit more realistic when we look at what has happened with the price of stamps in the past 10 years. Specifically, the stamps increased to $0.33 in 1999, $0.34 in 2001, and finally $0.37 in 2002. This prediction function would give us $0.337 in 1999, $0.353 in 2001, and $0.362 in 2002. Not bad for a linear prediction! But is it possible to do better with anther type of function?
EXCEL can also compute logarithmic, polynomial, power, and exponential prediction functions. It seemed to me that an exponential or power function would not be realistic, but that a logarithmic or polynomial function of degree 2 or 3 may work well. So I had EXCEL calculate all of the possible functions and recorded the R-squared value. According the EXCEL, the R-squared value or the coefficient of determination lets us know how close the values estimated from the prediction function are to the actual data values. This number is between 0 and 1, and the closer the number is to 1, the more reliable your prediction function is. Besides the R-squared value, I also wanted to look at the functions to make sure they were workable. That is, that they weren't too complicated so that it would be realistic that we could work with them. You can look at the EXCEL spreadsheet to see all of the functions, but what I decided was that the cubic prediction function starting from 1958 would be the best.
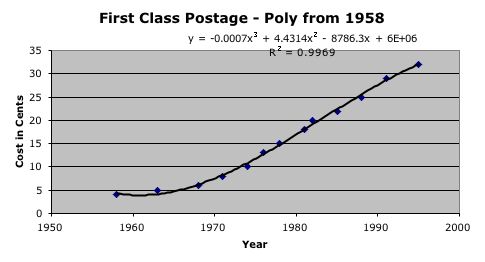
There were several reasons for my choice. Firstly, the R-squared value was 0.9969, which was the best value I found. Furthermore, the cubic function is still pretty easy to work with and the numbers were not that crazy. Finally, when I compared all the functions with how they would predict the cost of the stamps in 1999, 2001, and 2002, it seemed like the cubic function best matched what was really happening.
But what I was really thinking was that the data resembled a logarithmic function. Unfortunately, EXCEL does not have a trendline that is such a function, so I went to my TI-83 Plus and had that machine compute this prediction function. However, since the TI did not give me the R-squared value, all I could do was eyeball the graph to see if I thought that it looked closer, and honestly, they looked almost the same.

So which function should we use? There are pros and cons to both. The cubic function would be easier to work with and we have an R-squared value, but eventually, the cubic function will start to decrease which is unrealistic. The logistic function will never decrease and will eventually level off, which is also a bit unrealistic, and the function itself would be difficult to work with.
Based on these observations, I then checked to se which one would be able to predict the 2006 price increase of $0.39 more accurately. The cubic function gave me $0.36 again, but the logistic functions gave me $0.39. Thus, even though the logistic function is a more complicated formula, I would be inclined to use this one in my future predictions of stamp cost for the near future. If I wanted a function that would give me predictions farther into the future, I would be more inclined to use the quadratic function from 1933 to 1995 or the linear function from 1958. Which would you use?