
Experiences with experimental probability are recommended in students to improve their intuition and built more formal concepts of theoretical probability based on those experiences. To help this purpose spreadsheets are a powerful tool. Spreadsheets help students to construct a conceptual understanding and in many cases students generate new explorations and problem variations that can go far beyond the original problem situation.
Let us use spreadsheet in solving an interesting problem.
A common situation in blood banks is related to the the probability of getting the right blood donor. In a blood clinic there are 10 donors, 7 are found to be blood type O and 3 are of blood type B. Two questions are posed
(a) if a donor is selected at random what is the probability
that the donor will be found to be a blood type O?
(b) two patients are selected at random and the following events
are of interest.
E1, both patients ate of blood type O
E2 both are of blood type B
E3 the two patients are of the same blood type
E4 one is of blood type O and the other is of blood type B
What are the probabilities of each of these four events?
This problem was proposed by Callender & Jackson (1995)
The first stage to solve this problem is to make a tree diagram with all the possible combination of two patients. Let us assume that the patients with blood type O are the patients from 1 to 7, and the patients with blood type B are the patients from 8 to 10. Working systematically we choose the patient 1 as the first patient and then we list all the possible choices of the second donor. When we have finished with the patient 1 we continue with the patient 2 but this time we do not include the patient 1 so that we do not duplicate options.

Now let us use the information from the tree diagram in the spreadsheet. In the spreadsheet place the possible choices of the first donor in column A and the possible choices of the second donor in column B. In column C, if both donors are type O a 1 is going to be entered and 0 otherwise
Our spreadsheet is going to have some columns: one when both donors have type O, another one when both donors have type B, another one when both donors have the same type, another one when both donors have different types and the last one when both donors have either type B or the same type
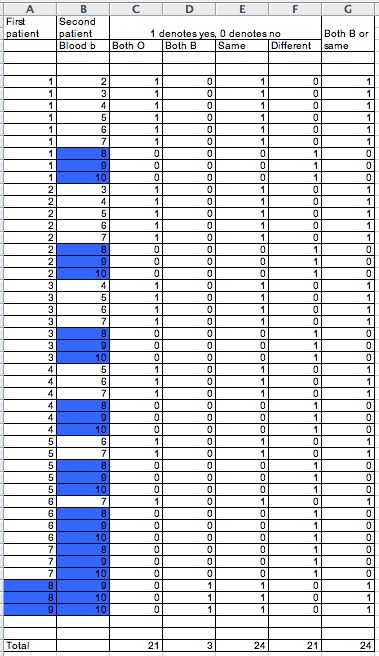
Some interesting result that could be noticed from the table
is that events E1 and E2 are mutually exclusive. Here if both
patients have type O they cannot have type B. This fact can be
noticed observing column C and column D of the spreadsheet. Beside
it could be noticed that E3 (both patients have the same type)
is a composition of the events E1 and E2. this is p(E3)=p(E1 or
E2)= p(E1)+p(E2) because they are mutually exclusive
This is 24/45=21/45+3/45
So we can estate two important results:
Addition law of probability and Complementary events
The events E3 (the two patients are of the same blood type)
and E4 (one is of blood type O and the other is of blood type
B) are complementary events. They are mutually exclusive and exhaustive.
So, we can calculate the probability of one of them if we know
the probability of the other one. this is p(E3)= 1-p(E4). We can
notice this fact from column E and F from the table.
24/45+21/45= 1
This result is really useful when is difficult to calculate the
probability of one event but is easy to calculate the probability
of the complement.
References
Ageel M.I. (2002) Spreadsheets as a simulation tool for solving probability problems. Teaching Statistics. Volume 24, Number 2, summer 2002
Callender and Jackson (1995) Exploring probability and statistics with spreadsheets. Great Britain: Hartnolls Ltd, Bodmin, Corwall