
Assignment #2 :: Transformations
of Parabolas :: Clay Kitchings
Interpret your graphs. What happens to ![]() (i.e., the case
where b=1 and c=2) as a is varied? Is there a common point to all graphs? What is it?
What is the significance of the graph where a = 0? Do similar
interpretations for other sets of graphs. How does the shape change? How does
the position change?
(i.e., the case
where b=1 and c=2) as a is varied? Is there a common point to all graphs? What is it?
What is the significance of the graph where a = 0? Do similar
interpretations for other sets of graphs. How does the shape change? How does
the position change?
The
first attempt at a graph was done with a-values [-4, 4] (not including
zero). I graphed these functions
using GSP.
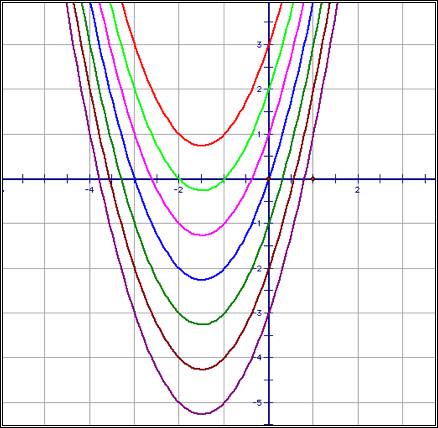
![]() (for a = -4, -3,
-2, -1, -0.5, 0.5, 1, 2, 3, 4)
(for a = -4, -3,
-2, -1, -0.5, 0.5, 1, 2, 3, 4)

We observe that (0, 2) is a common point on each
of the graphs. The significance of
the function when a = 0 is that it degenerates into a linear function (y = x +
2). We also observe that as |a|à0, the parabola widens.
Furthermore, for negative values of a, the graph is concave down, while for
positive values of a the parabola is concave up. For a-values that are opposite of each other, the parabolas
have the same shape, though the concavity of each is different. In summary, the a-value affects the
shape of the parabola and its concavity. It also has an affect on the vertex of
the parabola (in terms of its location).
It does not affect the y-intercept, which in this case is always 2.
Next,
we shall fix a = 1 and b = 3. We
shall evaluate how the c-value affects the graph. It is my first assumption (based on the above exploration)
that the c-value is the “y-intercept.” While we decided to “fix” the value of a =1, I also
demonstrate how the “c-effect” is consistent even if concavity changes.
![]() , where c = {-3, -2, -1, 0, 1, 2, 3} and for
, where c = {-3, -2, -1, 0, 1, 2, 3} and for ![]()
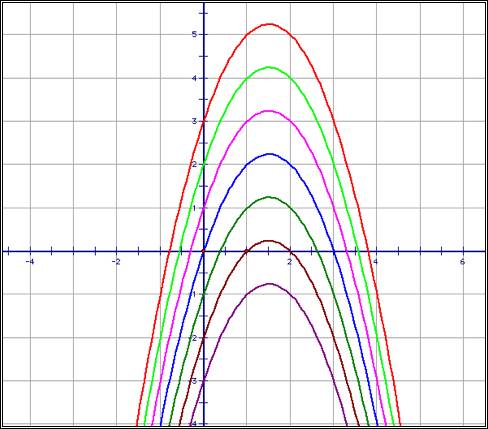
The
graphs on the left have positive coefficients of a and the graph on the right
has negative coefficients of a.
My suspicions are confirmed in the image above:
the c-values represent the y-intercepts of the parabolas. The shape of the
parabola is not affected by the c-value, nor is the concavity affected.