
Assignment 11
Conics in polar form
The circle, ellipse, parabola, hyperbola and a pair of
straight lines are collectively known as conic sections. The three conics
ellipse, parabola and hyperbola can be defined by one common property called
the focus-directrix property. Under this definition a conic section is the set
of points for which the ratio of the distance from a fixed point (called the
focus) and a fixed line (called the directrix) is constant. Consider the focus F and directrix d in Figure 11.1.
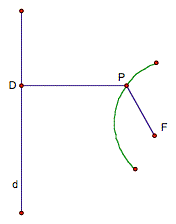
Figure 11.1
The set of points for which  is a constant generates a conic. This
constant is conventionally denoted by e and is called the eccentricity. Here, we shall denote this constant by
k. If
is a constant generates a conic. This
constant is conventionally denoted by e and is called the eccentricity. Here, we shall denote this constant by
k. If  , we have an ellipse;
if
, we have an ellipse;
if  we have a parabola and
if
we have a parabola and
if  we have a hyperbola.
Let us look at the derivation of the equation of these
conics in polar axis. For simplicity, we assume that the focal point F is at the origin. Let P have coordinates  , where
  is the angle measured anticlockwise from
the polar axis. Let F be at a
distance p from the directrix as
shown in Figure 11.2.
is the angle measured anticlockwise from
the polar axis. Let F be at a
distance p from the directrix as
shown in Figure 11.2.
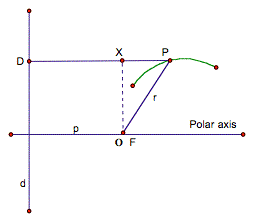
Figure 11.2


or  is the equation of the conic, where k is the eccentricity and p the distance between focal point and directrix.
In this derivation, we have chosen the directrix on
the left hand side of the focus in Figure 11.2. If we choose the directrix on
the right hand side, then the equation of the conic is  .
.
Further, if the directrix is horizontal, we have  depending whether the directrix is above
or below the focal point.
depending whether the directrix is above
or below the focal point.
CASE 1a
Ellipse (k< 1)
A
plot of  when p= 1 (i.e., distance from directrix to focal point is 1)
and when k is less than 1 is shown
in Figure 11.3.
when p= 1 (i.e., distance from directrix to focal point is 1)
and when k is less than 1 is shown
in Figure 11.3.
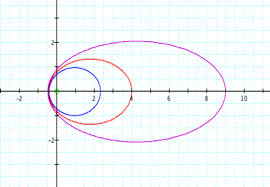
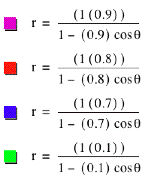
Figure 11.3
We observe that as the eccentricity increases from 0.1
to 0.9, the ellipse expands on the right hand side.
Figure 11.4 shows ellipses with constant eccentricity
(k = 0.9) with p varying from 1 to 3. As p increases, the
ellipse expands on the right hand side.
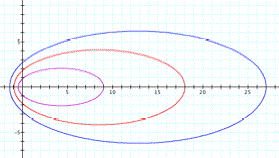
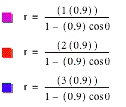
Figure 11.4
In Figure 11.5, the eccentricity is maintained at k = 0.9 and the distance between the directrix and
focal point is negative (i.e., p <
0) . The ellipses extend on the left hand side. This can be regarded as
shifting the directrix on the right of the focal point. For instance,  can be written as
  .
.
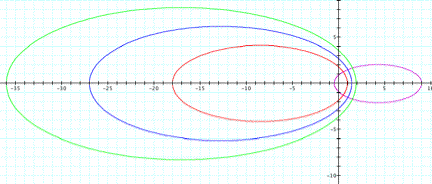
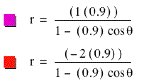
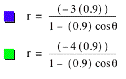
Figure 11.5
What is the effect of changing the eccentricity to a
negative value? Figure 11.6 shows that changing the eccentricity k = 0.9 to k
= - 0.9 or from k = 0.8 to k = - 0.8 has no effect on the shape of the ellipse as k is still less than 1.
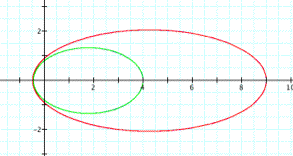
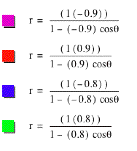
Figure 11.6
CASE 2a
Parabola (k = 1)
When the eccentricity is 1, we have a parabola. Figure
11.7 shows parabolas when the distance between the focal point and the
directrix changes from -3 to 3. As p
increases, the parabola expands. For positive values of p, the parabola expands on the right hand side while for
negative values of p, it expands
on the left hand side.
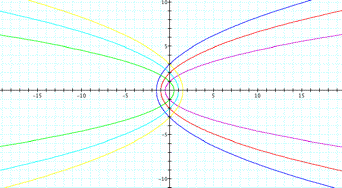
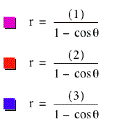
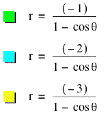
Figure 11.7
CASE 3a
Hyperbola (k > 1)
When the eccentricity is greater than 1, we have a
hyperbola. Figure 11.8 shows hyperbolas where the distance between focal point
and directrix is 1. As eccentricity increases, the hyperbola expands.
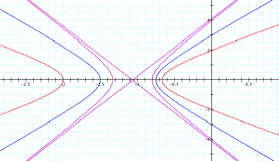
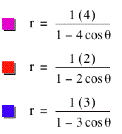
Figure 11.8
Question: For what value of k do we have a rectangular hyperbola?
Now, we plot the conics  and
and  for varying values of p and k.
CASE 1b Ellipse (k< 1)
p = 1 and
k varies from 0.1 to 0.9.
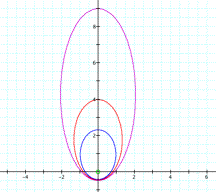
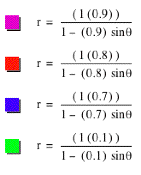
Figure 11.9
As the value of the eccentricity (k) increases from 0.1 to 0.9, the ellipse expands along
the positive side of the y-axis for
 .
.
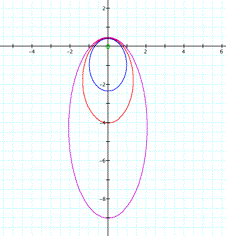
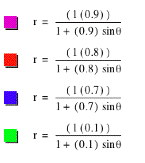
Figure 11.10a
In the case of  , the curve expands
along the negative side of the y-axis as shown in Figure 11.10a.
, the curve expands
along the negative side of the y-axis as shown in Figure 11.10a.
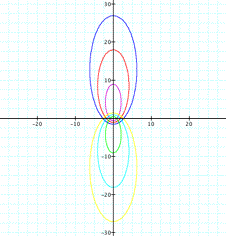
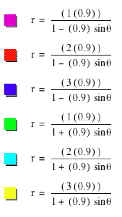
Figure 11.10b
Figure 11.10b shows the effect of increasing the value
of p from 1 to 3 while maintaining
eccentricity constant at k = 0.9.
CASE 2b
Parabola (k = 1)
p varies from 1
to 3
Similar patterns are observed in the case of parabolas
and hyperbolas (Figure 11.11 and Figure 11.12). The shape of the parabolas and
hyperbolas are conditioned by the magnitude (and sign) of the distance between
focal point (p) and eccentricity (k).
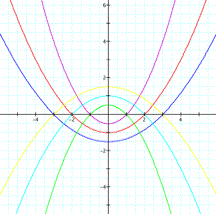
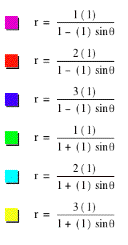
Figure 11.11
CASE 3b
Hyperbola (k > 1)
p varies
from 1 to 3.
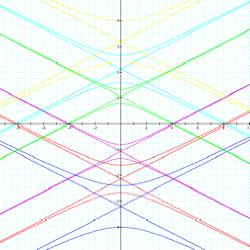
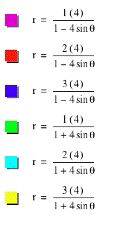
Figure 11.12
Using the definition  from Figure 11.1 for k
< 1, k = 1, and k
> 1, we can construct ELLIPSE, PARABOLA and HYPERBOLA
using GSP.
from Figure 11.1 for k
< 1, k = 1, and k
> 1, we can construct ELLIPSE, PARABOLA and HYPERBOLA
using GSP.
Ajay Ramful
21 November 2006