
Assignment 2
A particular rational function
This
assignment analyses the curve
 ,
,
where n is a constant.
A
plot for n = -2, -1, 0, 1, and 2
is shown in Figure 2.0 below.
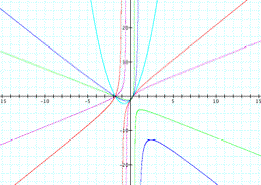
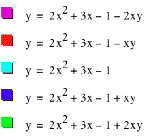
Figure 2.0
Figure 2.0 shows that the equation  represents a
family of hyperbolas, except for
n = 0 in which case we have
a parabola.
represents a
family of hyperbolas, except for
n = 0 in which case we have
a parabola.
The equation can be written as a rational function
i.e.,

provided  .
.
The numerator can be factorized and the equation can
be written as

or

The
curve crosses the x-axis at the points  and
and  or
or  and
and  . Further, the line
  is a
vertical asymptote.
is a
vertical asymptote.
As
can be observed from the equation  , the degree of the numerator is greater than the
degree of the denominator by one.
This shows that there is a slant or oblique asymptote. Diving the
numerator by the denominator gives
, the degree of the numerator is greater than the
degree of the denominator by one.
This shows that there is a slant or oblique asymptote. Diving the
numerator by the denominator gives 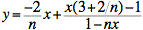 . Thus,
  is
the equation of the oblique asymptote.
is
the equation of the oblique asymptote.
Let
us determine the turning points.

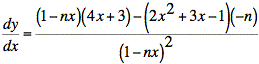
Setting
 , we have
  On simplification, this gives the quadratic
  , which can be solved for different values of n. Note that for each value of n, we have two turning points. Now let us observe the
behavior of the curve when n = 1,
2, 3, and 4.
, which can be solved for different values of n. Note that for each value of n, we have two turning points. Now let us observe the
behavior of the curve when n = 1,
2, 3, and 4.
CASE 1 n = 1, 2, 3 ,4
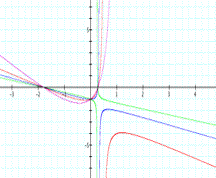
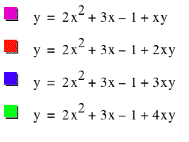
Figure 2.1
We observe that as the value of n increases from 1 to 3 the two parts of the hyperbola
approaches each other. However, as the value of n changes from 3 to 4, the hyperbola changes
orientation. The vertical asymptotes for the four values of n are  ,
,  ,
,  and
and  and the oblique
asymptotes are
and the oblique
asymptotes are  ,
,  ,
,  and
and  .
.
Click HERE for animation
As we can observe from the animation (or Figure 2.2
below), the curve splits somewhere between n = 3 and
n = 4. Let us find the
precise point where the split occurs.
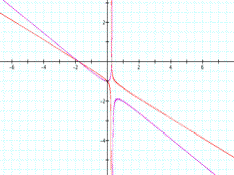
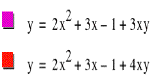
Figure 2.2
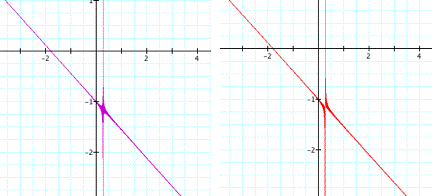


Figure 2.3
Figure 2.3 shows that the curve splits at  . The explanation for this particular value of n is given below.
The original equation can be written in the form
 (1)
(1)
Therefore, when  or
or  , equation (1) simplifies to a linear equation as shown
below:
, equation (1) simplifies to a linear equation as shown
below:
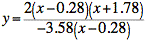

The two lines that we see in Figure 2.3 have equations
 (the vertical
asymptote) and
(the vertical
asymptote) and  .
.
Similarly, when  or n = - 0.56 in equation (1), we have
 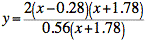 or
or  .
.
CASE 2: Figure
2.4 shows the graph for 
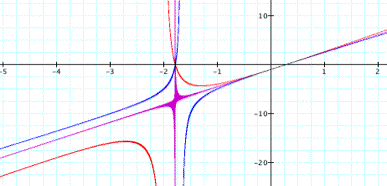
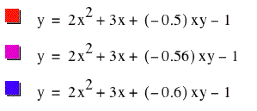
Figure 2.4
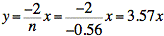
The vertical asymptote for n = -0.56 is 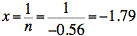 and its
corresponding oblique asymptote is
and its
corresponding oblique asymptote is
 .
.
This assignment has analyzed the equation  . In the next assignment (assignment 3), we consider the
behavior of cubic functions.
. In the next assignment (assignment 3), we consider the
behavior of cubic functions.
30 September
2006
Ajay Ramful