|
Michelle E. Chung |
*
EMAT6680 Assignment 10: Parametric Curves |
|
|
1. Graph
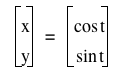 for
for 
How do you change the equations to explore other graph?
|
 |
The equation is a parametric equation. So, if you want to draw it, you have to use the relationship
among the variables.
First, since we know that 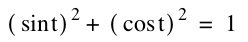 , we can substitude x=cos t and y=sin t to it. , we can substitude x=cos t and y=sin t to it.
Then we would have 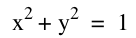 . .
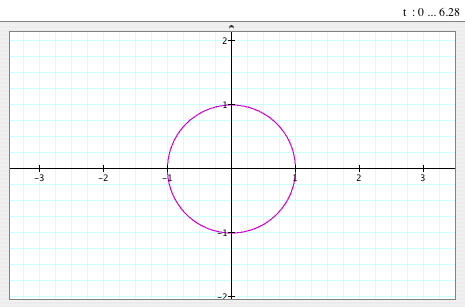
As we know, this is the equation of the circle that has (0,0) as its center and
1 as its radius and the following is the graph:
|
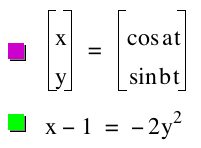
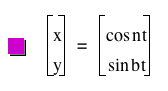
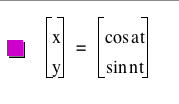
2. For various a and b, investigate
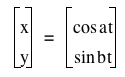 for
for
|
|
When
a=1, b=1

|
|
|
- As we see from the first case, if a=b=1, the graph of the parametric equation is a
circle that has (0,0) as its center and 1 as its radius.
|
When a=2,
b=1
|
|
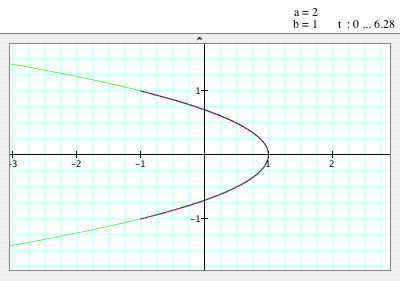
- However, if a=2 and b=1, the graph looks like a parabola that (1,0) as its vertex
and p is about 1/2.
|
|
When a=2, b=-1
|
|
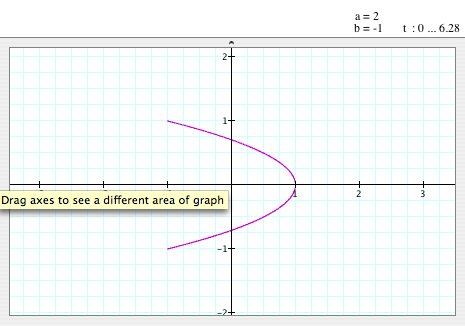
- As we see, the sign of value of 'b' dosen't matter to the graph. Even though
we have b=-1 instead of b=1, we still have the same graph.
|
When
a=-2, b=1
|
|
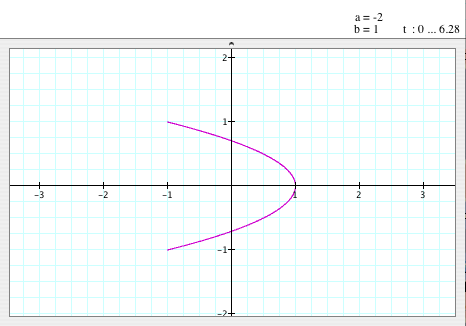
- As we see, the sign of value of 'a' also dosen't matter to the graph. Even though
we have a=-2 instead of a=2, we still have the same graph.
- So, now we know that the sign of 'a' and 'b' don't matter to the graph.
|
When a=1,
b=2
|
|
|
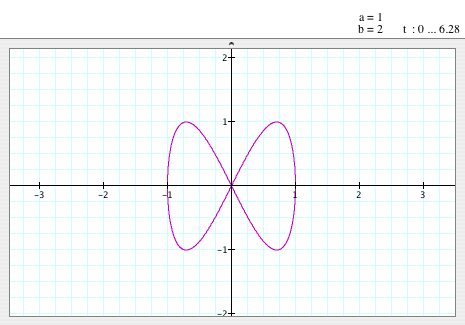
- When a=1 and b=2, the graph of the equation looks like a bow- tie.
- The graph is symmetric to the y-axis.
|
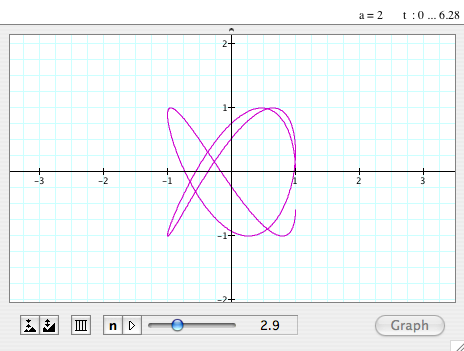
When a=2,
b=2
|
|
|
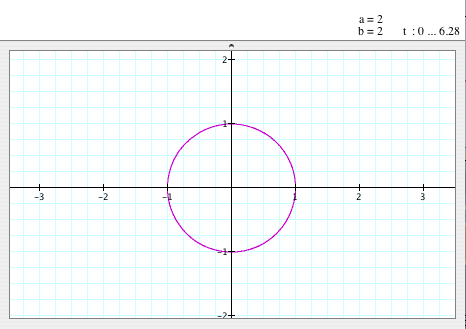
- When a=2 and b=2, the graph of the equation looks like a circle, which has (0,0)
as its center and 1 as its radius, again.
|
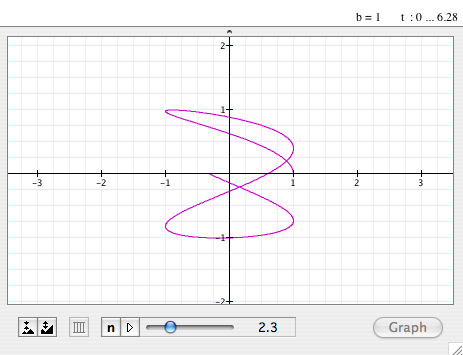
When b=1
and vary a
|
|
|
|
| |
|
- As we see, when b=1 and 'a' veries, the graph starts from a circle, which has
(0,0) as its center and 1 as its radius, and is changing to
a kind
of
3D-sine/cosine graph, which means its amplitude is 1 (here,
we can see it on the x-axis) and its period is decreasing as
the
value
of 'a' is increasing. Also, it forms a circle on the yz plane
(if we can imagine..., like, we are looking at it from x-axis...).
- The graph is always passing (1,0).
|
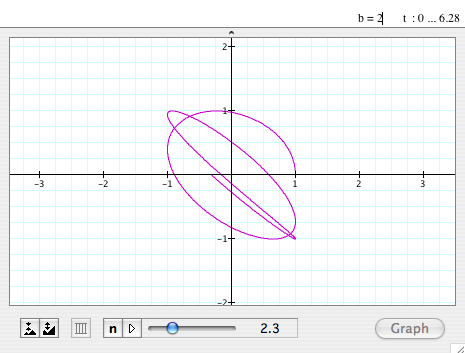
When b=2
and vary a
|
|
|
 |
| |
|
- This looks similar to the graph of when b=1 if the value of 'a' is big enough,
but the starting is a little bit different.
The part of it looks like a sine/cosine graph on the x-axis.
- The graph is always passing (1,0).
|
When a=1
and vary b
|
|
|
 |
| |
|
- As we see, when a=1 and 'b' veries, the graph starts from a circle, which has
(0,0) as its center and 1 as its radius, and is changing to
a kind
of
3D-sine/cosine graph, which means its amplitude is 1 (here,
we can see it on the y-axis) and its period is decreasing as
the
value
of 'b' is increasing. Also, it forms a circle on the xz plane
(if we can imagine..., like, we are looking at it from y-axis...).
- The graph is always passing (1,0).
|
| When a=2 and
b vary |
|
|
 |
| |
|
- This looks similar to the graph of when a=1.
- The graph is always passing (1,0).
|
| When a=3 and
vary b |
|
|
 |
| |
|
- This looks similar to the graph of when a=1, too. Maybe its period is a little
shorter that the other.
- The graph is always passing (1,0).
|
|
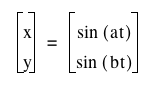
11. Inveatigation.
Consider the parametric equations
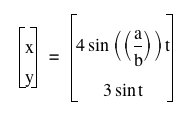 for for  . .
Graph these for 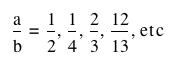 . .
Describe fully.
You may have to increase the range of t for the larger
fractions.
This class of parametric curves are called the Lissajous
curves. Compare with
|
|
Let's investgate the graph of
 . .
When a=1, b=2
(i.e. a/b = 1/2) |
|
|
- When a=1 and b=2, the graph looks like a bow tie.
- It is symmetric to the x-axis and to the y-axis.
- It passes the origin, (0,0).
|
When a=1, b=4
(i.e. a/b = 1/4) |
|
|
- When a=1 and b=4, the graph still looks like a bow tie, but with more bow.
It seems to have more bows as the value of 'b' is increasing.
(when 'a' is fixed!)
- It is still symmetric figure to the x- and y-axis.
- It still passes the origin, (0,0).
|
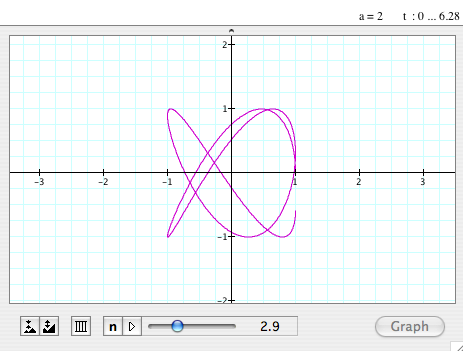
When a=2, b=3
(i.e. a/b = 2/3) |
|
|
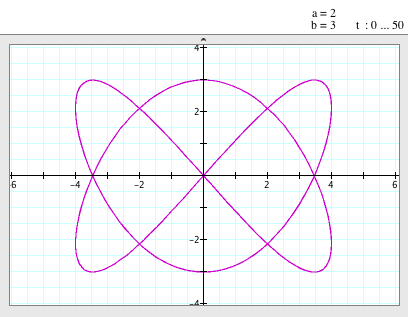
- When a=2 and b=3, it looks like a little bit weird bow tie. ^^;
- However, it is still symmetric to the x- and y-axis and passes the origin, (0,0).
|
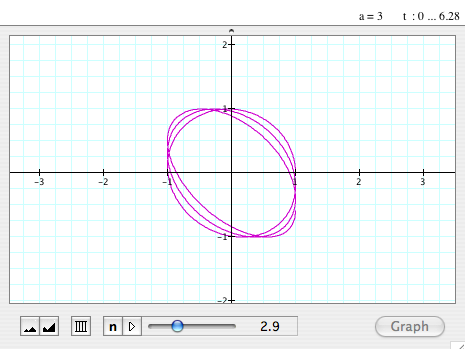
When a=12, b=13
(i.e. a/b = 12/13) |
|
|
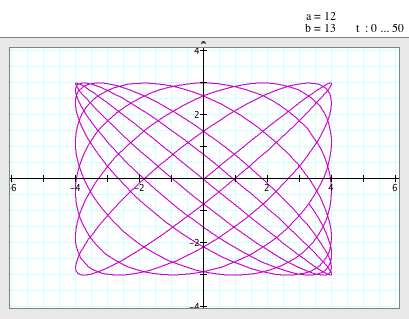
- Now , it looks like a rectangle with some curved lines.
- However, it is still symmetric to the x- and y-axis and passes the origin, (0,0).
|
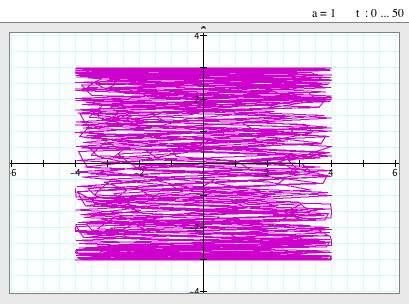
When a=1 and vary b
|
|
|
- The graph of this function looks like a combination of and .
- It always passes the origin, (0,0).
|
| When a=1, b=0 |
|
|
|
| When a=1, b=-1 |
|
|
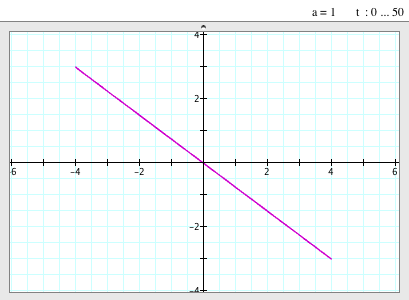
- When a=1 and b=-1, the graph is a straight line.
|
When a=2 and vary b
(interval [-10,10]) |
|
|
- The graph looks similar to the one when a=1.
|
| When a=2, b=0.4 |
|
|
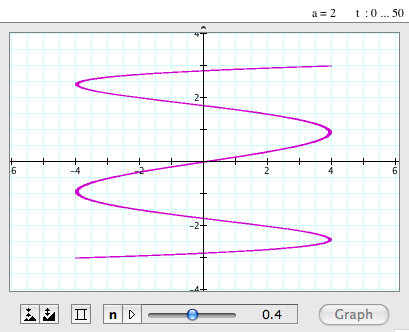
- When a=2 and b=-0.4, the graph looks like a 90 degrees rotated sine/cosine graph.
- It passes the origin, (0,0).
|
| When a=2, b=-0.4 |
|
|
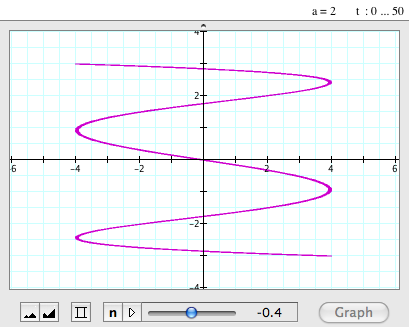
- When a=2 and b=-0.4, i.e. the value of 'b' is opposite, the graph is a reflection
of the one when a=2 and b=0.4.
- It also passes the origin, (0,0).
|
| When a=2, b=-6 |
|
|
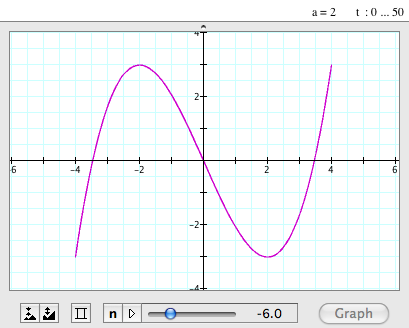
- When a=2 and b=-6, the graph looks like a reflected (to the y-axis) sine graph.
- It passes the origin, (0,0).
|
| When a=2, b=6 |
|
|
- When a=2 and b=6, the graph looks like a sine graph and is also a reflection
of the one when a=2 and b=-6.
|
|
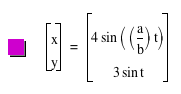
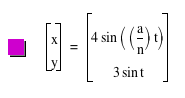
Let's compare the graphs of
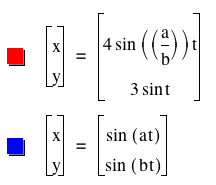 . .
|
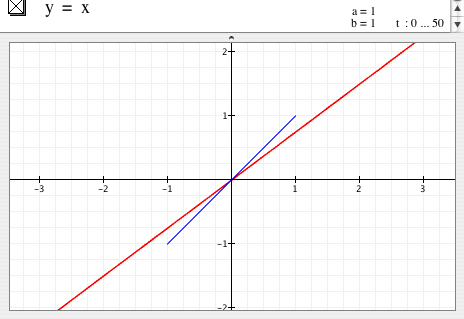
When a=1, b=1
|
|
|
|
| |
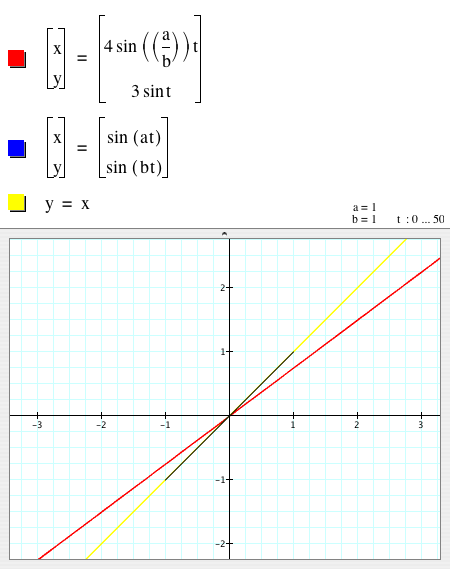
- When a=1 and b=1, the graph of is a line passing through (0,0) and (1, 0.75); however, the graph of is a line segment, which is part of the line y=x between x=-1 and x=1.
|
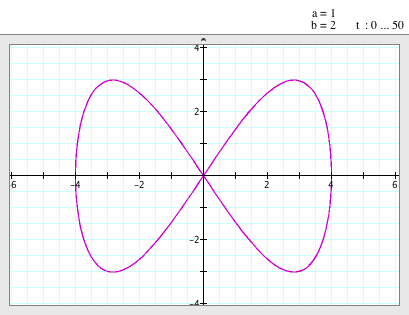
When a=1, b=2
(i.e. a/b = 1/2) |
|
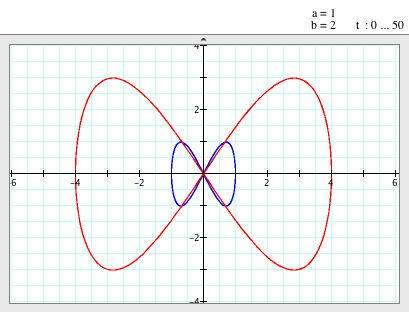
- When a=1 and b=2, i.e. a/b=1/2, the both graphs look like bow-ties.
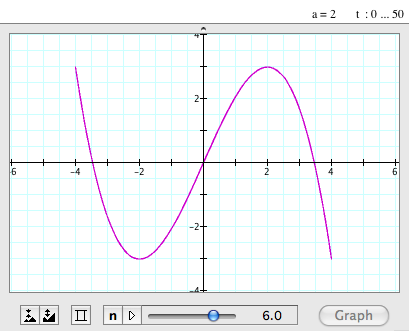
- The graph of looks like a bow-tie that passes through (-4,0), (0,0), and (4,0), and the maximum value of the graph is 3 and the minimum is -3.
- The graph of also looks like a bow-tie, but it is much smaller. It passes through (-1,0), (0,0), and (1,0), and its maximum is 1 and minimum is -1.
|
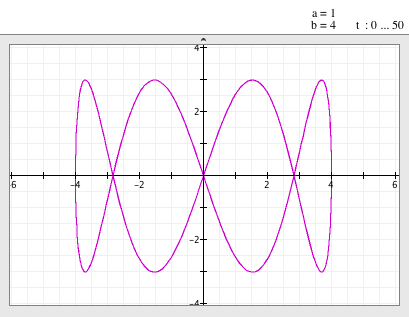
When a=1, b=4
(i.e. a/b = 1/4) |
|
|
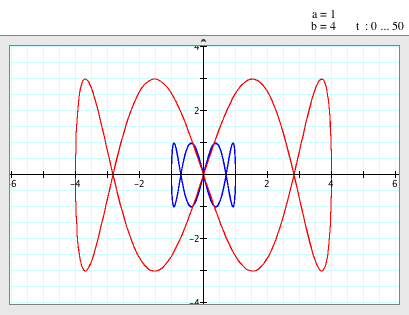
- When a=1 and b=4, i.e. a/b=1/4, the both graphs look like double bow-ties.
- The graph of has four parts that look like the combination of part of sine graph and -sine graph; however, it still passes through (-4,0), (0,0), and (4,0), and its maximum and minimum are still 3 and -3.
- The graph of also four parts that look like the combination of part of sine graph and -sine graph, but it is much smaller. It still passes through (-1,0), (0,0), and (1,0), and its maximum and minimum are still 1 and -1.
|
When a=2, b=3
(i.e. a/b = 2/3) |
|
|
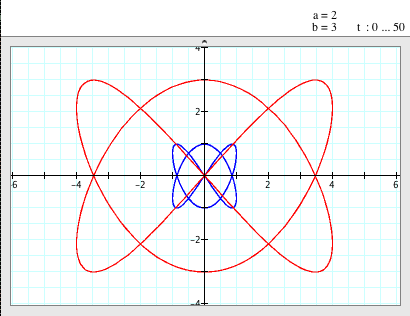
- When a=2 and b=3, i.e. a/b=2/3, the both graphs look like two boomerangs.
- The graph of doesn't passes through (-4,0) and (4,0) anymore but still passes through (0,0). Also, its maximum and minimum are still 3 and -3.
- The graph of doesn't passes through (-1,0) and (1,0) anymore but still passes through (0,0). Also, its maximum and minimum are still 1 and -1.
|
When a=12, b=13
(i.e. a/b = 12/13) |
|
|
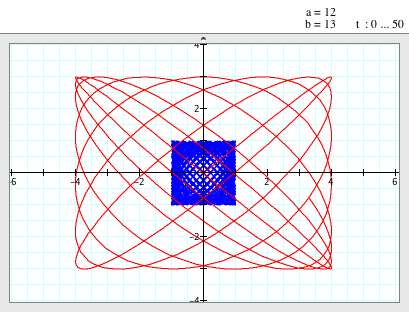
- When a=12 and b=13, i.e. a/b=12/13, the graphs look like rectangle made out of curve lines.
- The graph of doesn't passes through (-4,0) and (4,0) anymore but still passes through (0,0). The graph starts from (0,0) and go around y=-3/4 so that form the rectangular shape. Also, its maximum and minimum are still 3 and -3.
- The graph of doesn't passes through (-1,0) and (1,0) anymore but still passes through (0,0). Also, its maximum and minimum are still 1 and -1.
|
|
 Go Back to Top Go Back to Top |
|
Go
Back to Michelle's Main page |
|
Go
Back to EMAT 6680 Homepage |
Copyright
@ Michelle E. Chung |