
Exploration of Parabolas
by
Gayle Gilbert
We’re going to explore the
equation of a parabola: y=ax2+bx+c for
different values of a, b, and c. First, let’s look at the graph of a
basic parabola y=x2, where a=1, b=0, and c=0:
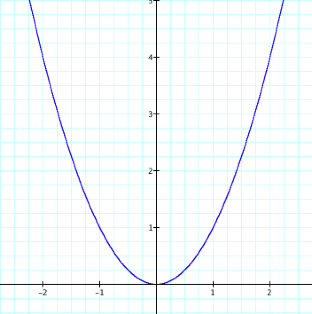
Notice the graph opens up,
the vertex is at x=0, and the y-intercept is at y=0. Let’s vary the value of a to determine how the graph changes. Let’s graph y=x2 (blue),
y=¼x2 (green), y=½x2 (purple), y=2x2
(red), and y=4x2 (black) on the same axes.
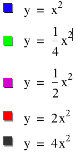
For all these positive values
of a, the graph still opens
up. Notice when 0<a<1, the graph appears to be stretched horizontally,
and when a>1, the graph appears
to be compressed horizontally.
What happens when a<0? Well, we know if a=0, then y=0, which is the x-axis, so we can make
assumptions about what the graph will look like when a is negative.
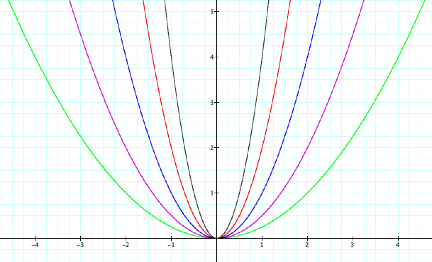
We can guess that the graph will reflect about the x-axis when a is negative.
Let’s graph y=x2 (blue), y=-x2 (aqua),
y=-¼x2 (green), y=-½x2 (purple), y=-2x2
(red), and y=-4x2 (black) on the same axes.
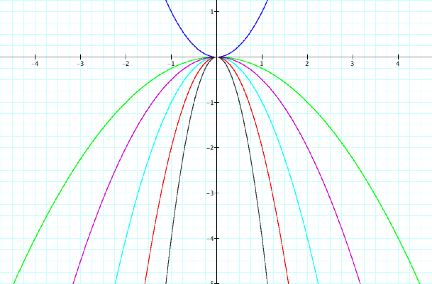
Notice that our hypothesis is
correct: when -1<a<0, the
graph appears to be stretch horizontally below the x-axis, and when a<-1, the graph appears to be compressed
horizontally below the x-axis.
Thus, when a is negative,
the graph opens down.
Now, let’s look at different
values of b while fixing a=1 and c=0
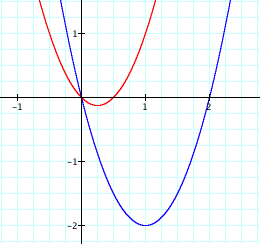
in the equation y=ax2+bx+c. First, let’s graph y=x2+x
(red), where b=1, on the same
graph with y=x2 (blue):
![]()
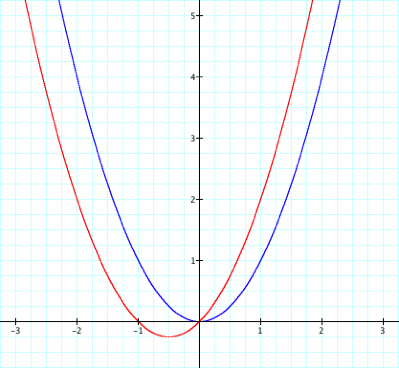
How does the graph
change? What hypothesis do we want
to make about the effects of the value of b on the function? Well, we notice that the graph has shifted to the left
½ and down ¼; however, the shape is not affected. Let’s explore
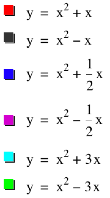
further by graphing y=x2+x (red), y=x2-x (black), y=x2+½x
(blue), y=x2-½x (purple), y=x2+3x (aqua), and y=x2-3x
(green) on the same graph.
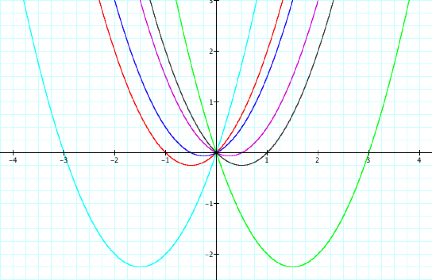
Notice as b increases from 0, the vertex shifts to the left and down from the origin; as b decreases from 0, the vertex shifts to the right and down from the origin. The graphs with negative values of b are just reflections about the y=axis of the graphs with positive values of x. When b=1, the vertex is at x= -½ and when b=-1, the vertex is at x=½; when b=½, the vertex is at x=-¼ and when b=-½, the vertex is at x=¼; when b=3, the vertex is at x=-1.5 and when b=-3, the vertex is at x=1.5. From this, it appears that the vertex is at x=-b/2. Let’s explore further to see if our hypothesis is correct.
What happens when we graph y=2x2+bx for different values of b? Let’s graph y=2x2-x (red) and y=2x2-4x (blue):
The vertex when a=2 and b=-1 is at x=¼, and the vertex when a=2 and b=-4 is x=1. Now, we see that our hypothesis is not completely correct, for –b/2 for the first graph would give us ½, but we have ¼. Instead, it must be –b/2a since a=1 on our previous graphs and that works here as well.
Finally, let’s see what happens to the graph when we change our value of c. Let’s graph y=x2+x+c for different values of c (note: our a=b=1). Here is the graph of y=x2-x (blue), x2-x+2 (red), x2-x+ ½ (green), x2-x-3 (purple):
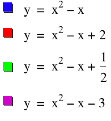

Notice that the c is the y-intercept of each graph.
What do you think the graph of y=-¼x2+3x-1 will look like? Well from our discoveries, we can say that the graph will open down since a is negative. We also know that the graph will be fairly wide since -1<a<0. The vertex will be at x=-3/(2*(-¼))=6, so the point is at (6,8). The y-intercept will be at y=-1. Let’s graph to check.
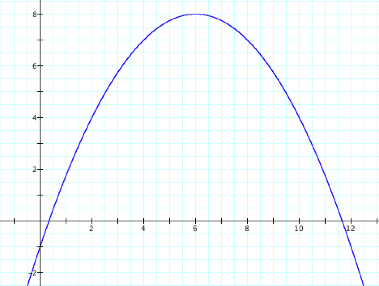
Yes! That is correct. I think we now have a pretty good understanding of parabolas. For a recap, when a is positive, the graph opens up. When a is negative, the graph opens down. When |a|<1, then the graph stretches horizontally; when |a|>1, the graph compresses horizontally. The value of b helps us determine our vertex. The x-coordinate of our vertex is x=-b/2a. Finally, the value of c gives us the y-intercept.