
Quadratic Functions
I will examine the graphs of
quadratics in standard form by keeping 2 values fixed and varying one value.
I will first keep a and b
constant while varying c.
>![]()
>![]()
>![]()
>![]()
>![]()
>![]()
>![]()
The arrows indicate the color of the graph.
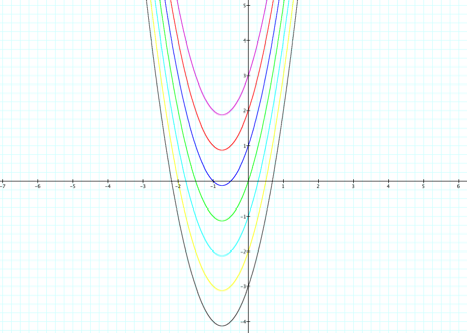
As you can see, it looks as
if c causes a vertical translation. It looks like a positive c value raises the
graph and a negative c value lowers it. I don’t notice any other changes in the
graph.
Now, let’s see what happens
when a and c remain constant and b is varied.
>![]()
>![]()
>![]()
>![]()
>![]()
>![]()
>![]()
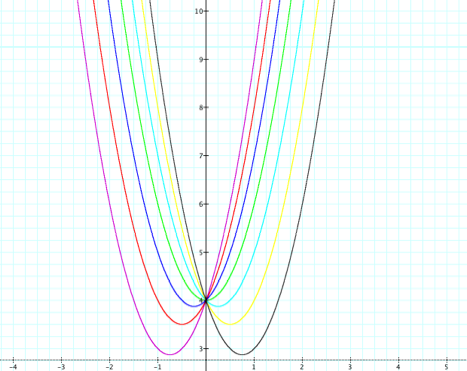
From the graphs and equations
it looks like b causes a horizontal shift in the parabola. I also notice that all of the parabolas
intersect the y-axis at 4, which is the value of c.
Finally, let’s look at what
happens to the graph of the parabola as we vary a and keep b and c as
constants.
>![]()
>![]()
>![]()
>![]()
>![]()
>![]()
>![]()
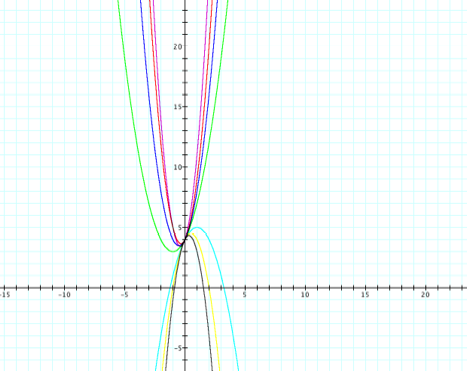
This is very intersecting.
The a value appears to control whether the parabola opens up or down. The
turquoise, gray and yellow graphs of parabolas open down and the a value of all
three are negative. There is also some relationship between a and the location
of the vertex. I did not include when a=0. Let’s see what this looks like.
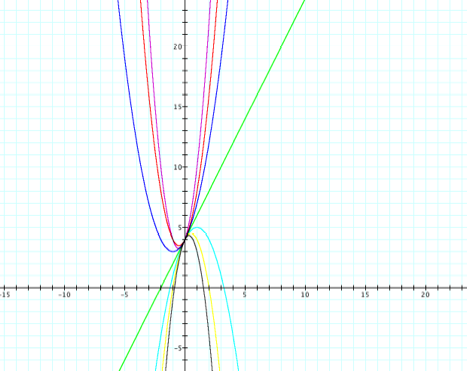
This equation is a linear
function and separates the negative and positive values by a line.