
ASSIGNMENT 2
EXPLORING Y = AX^2
BY:
DEBORAH ECKSTEIN
For assignment 2 I choose to explore problem #5. The problem asks us to try different graphs of y = ax^2 and have them all be on the same axis. In order to do this will we only be changing the value of a!
When first looking at the equation y = ax^2 we know that we will be graphing a parabola. A parabola is the set of all points that are the same distance from a fixed line called the directrix and a fixed point called the focus, that is not located on the directrix. In other words, for every two same numbers of x with opposite signs, there will be only one value for y. So if we have 3 and -3 we could say that for a given parabola they would share a common y value. This characteristic makes all parabolas symmetric!
Let's start putting in values for our parabola formula and see what we discover. For our first investigation I will use all positive values of a.
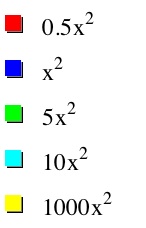

We let all of our values for a be positive and notice that the graphs of our parabolas open up and therefore are positive. Will that always be the case when we have a positive out in front of our equation?
Now let's look at a second set of equations where our a values are negative.
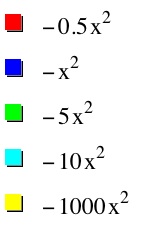
Notice that all of our parabolas open downward and therefore are negative. And once again we have to question whether or not that will always be the case.
Now comparing the two cases we can notice a few similarities. One being that both graphs are symmetric, which is what we discussed before starting our problem. Another similarity is the fact that for our positive values of a we got positive parabolas that open up and for our negative values of a we got negative parabolas that open downward. Let's think about why this is so. Looking at the original formula y = x^2 we notice that x^2 will always be positive because when you square a number it always comes out positive. Therefore the sign of our parabola, or the direction for which it will open, depends on our sign value of a! So when a is positive our parabola is also positive and when a is negative our parabola is also negative.
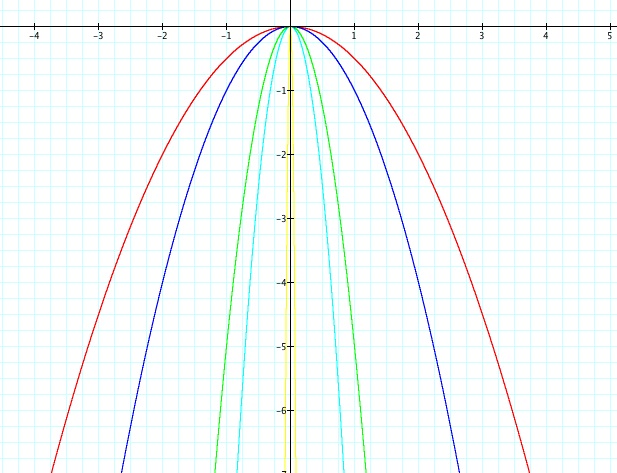
So after all this we have to wonder if there is a point at which the graph does a flip over our x axis, in which our parabola would change signs. Let's set a graph with positive and negative values to see what happens as our values for a get close to 0.
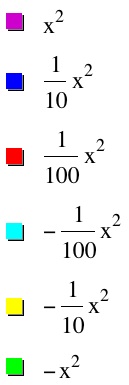
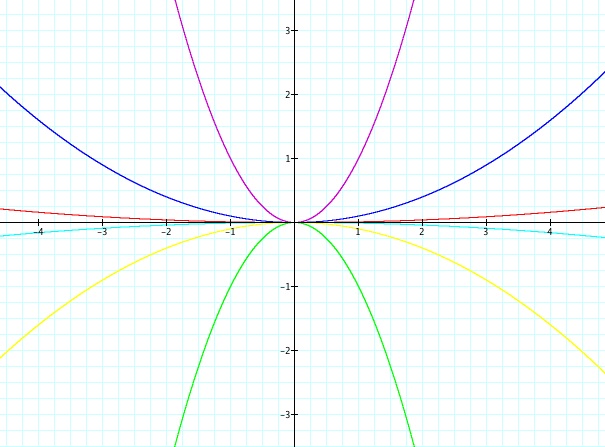
From the graph we can see that as our values of x get smaller our parabola gets wider and closer to our x axis. Let's put in 0 for our y in the equation to find out what value we must have in order for our parabola to be the x axis. So substituting in we get 0 = ax^2. In order to satisfy this equation we see that our x value would have to be 0! So our point (0,0) is where it makes a flip over the x axis and the parabola goes from being positive to being negative or vice versa.
From this assignment and basic parabola equation we now know how to set a value for a that will determine what kind of parabola we will have!