

Jogging Wild
After a lot of convincing my Grandma decided to finally start her jogging. This means that now her quadratic equation now has a constant. So with the minimum work out being 1 minute of jump roping, 1 game of horse shoes, and jogging 1 lap my Grandma used her magic to come up with the graph of the equation she has now: 1x2 + 1x + 1.
Grandma's Latest Graph
Jump Rope for 1 minute
Play one game of Horse Shoes
Jogging 1 Lap

Just like before my Grandma decided to keep a record of the number of laps that she did per day throughout the week to see how her graph will change. The table below was created with Grandma only working out with one minute of jump rope and one game of horse shoes.
| 2 | 3 | 5 | 7 | 9 |
|---|---|---|---|---|
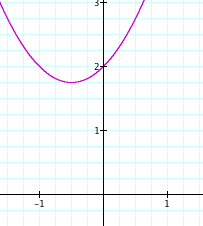 |
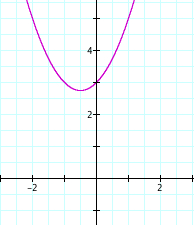 |
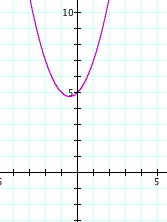 |
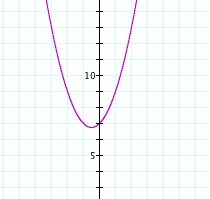 |
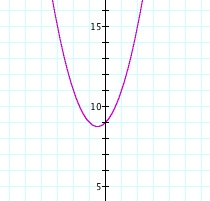 |
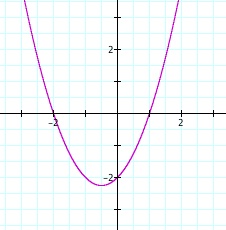
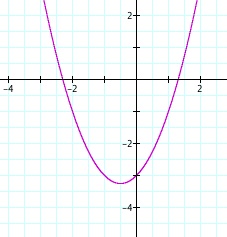
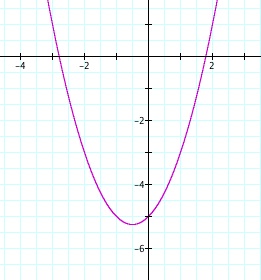
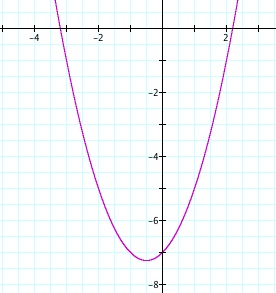
Grandma and I looking at this collection of graphs were, to be honest, a little disappointed with the rather dull movement of the graph. The only thing that changed with the constant was that the vertex moved up. We made the conjecture that whatever number is added to the equation is how much the graph moves up, and that whatever negative number is added to the equation is how much the graph moves down. To demonstrate this, my Grandma decided that the number of laps she runs will count as a negative number. When she did this the following data was collected:
| -2 | -3 | -5 | -7 | -9 |
|---|---|---|---|---|
 |
 |
 |
 |
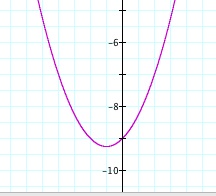 |
Once again we were a little disappointed with the results, and showed that our conjecture was true. Just to please my Grandma I decided to make a small movie showing the constant changing and how that is affecting the graph when -10 < c < 10. With all the results my Grandma was happy because starting out with her parent function now she can estimate what the function would like based on her work out.