
Explored by:
Aubrey D. Johnson

Explored by:
Aubrey D. Johnson
We know what a basic parabola graph looks like. We will now examine the parabola graph in relation to the b axis.
We will change the "b" in the formula to a "y" for graphing purposes only. Note, the y-axis will be referred to as the b-axis during this exercise.
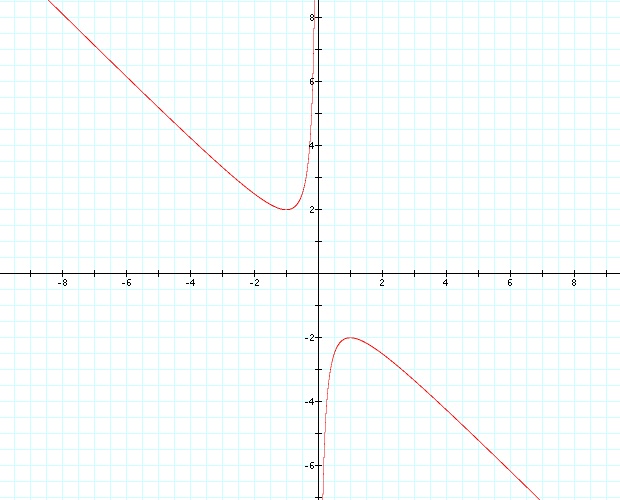

We will choose a a number on the b-axis, let us choose b=4. We will draw a line at b=4.
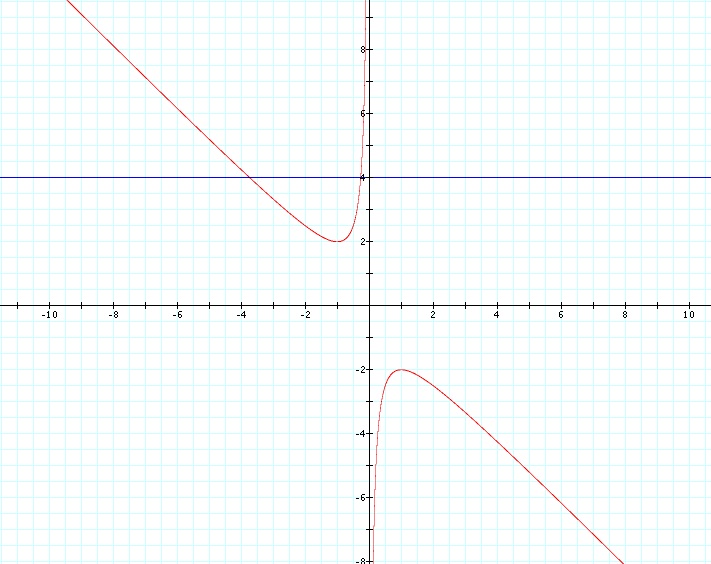

Notice that we can place a line that is horizontal to the x-axis anywhere on the graph. Note that we will not be able to place line that intersects the graph between -2<b<2. The blue line intersects our graph at the roots of the original equation.
Now, how will our graph change if we alter our c value from 1 to -1?
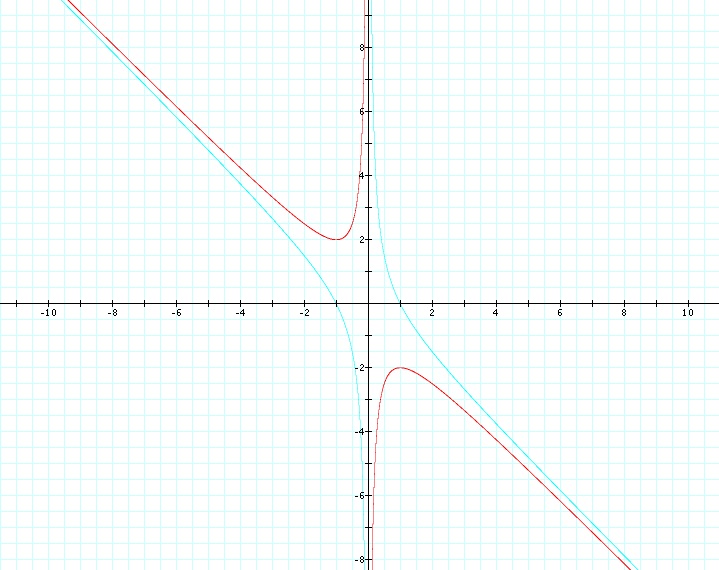
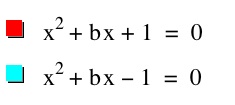
Notice that this new value of c has made the graph wider. Notice that this mew graph intersects the x-axis at 1 and -1 and uses the b-axis as an asymptote. Both graphs use the b-axis as their asymptote. The -1 only made the graph wider. The light blue graph is also in all four quadrants whereas the red graph is only in Quadrants II and IV.
We will now investigate how other c values alter the appearance of the graph.
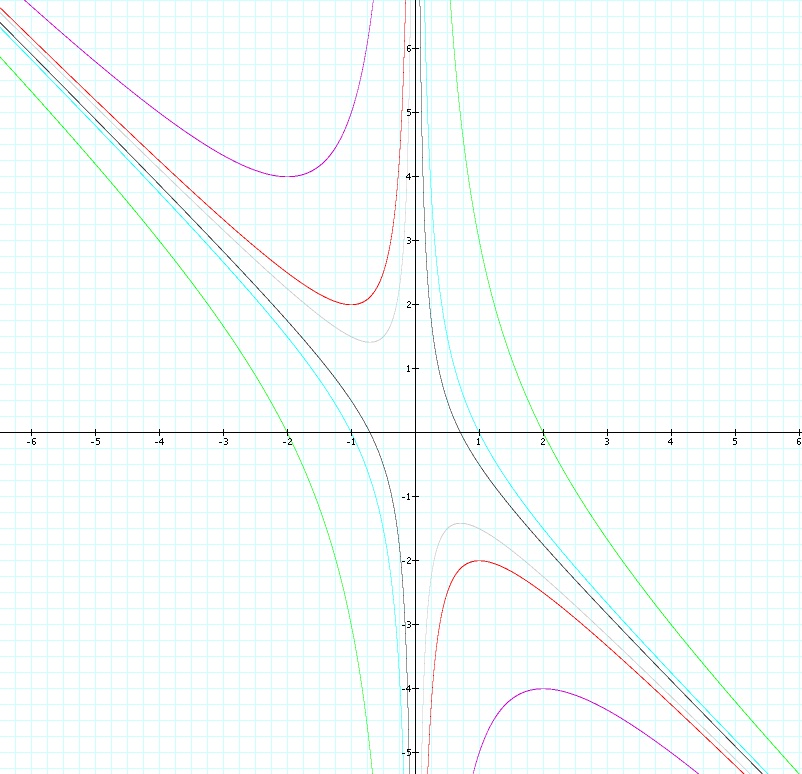
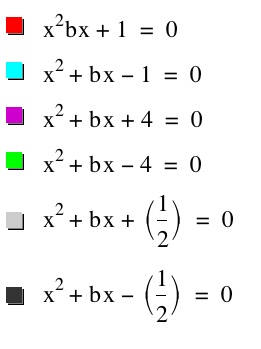
Now that we have more options in front of us, we can compare the graphs and figure out the purpose and the effect of the "c" in the equation. First let us notice the change between the positive and negative graphs. The negative graphs (light blue, green and black) widen the original equation and make the graph intersect the x-axis. Notice also, that the negative graphs intersect the x-axis at the square root of the "c" value. On the green graph c=4 and the square root of 4 is 2, and this graph intersects the x-axis at 2 (and -2). The light blue graph intersects the x-axis at 1 (and -1). Even (1/2) crosses the x-axis at its square root, which is approximately .707 (and -.707). Also notice that the graphs cross at both possible square roots the positive and the negative.
Looking at the positive graphs (red, pink and gray) notice that the c value determines the distance of the edge of the graph from the origin. The smaller the c value, like c=(1/2) the closer to the the origin the graph gets. The pink graph, c=4, is the furthest from the origin on our graph, it is also the largest c-value that we used.
Notice that all six graphs use the b-axis as an asymptote.