Translations of a parabola
by
Hee Jung Kim
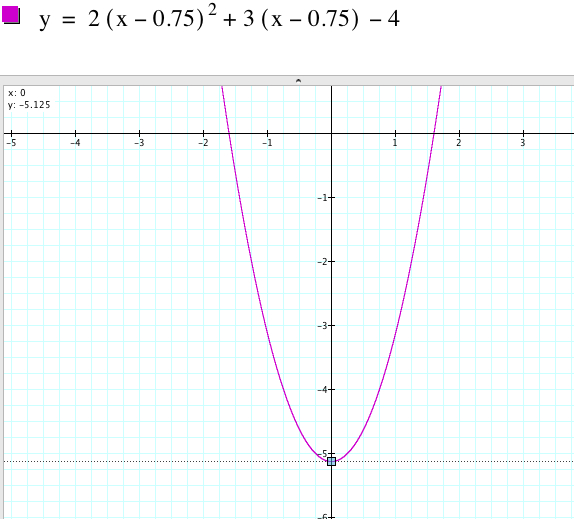
Let's graph the function
![]() .
.
The graph is a parabola which opens upward with following features:
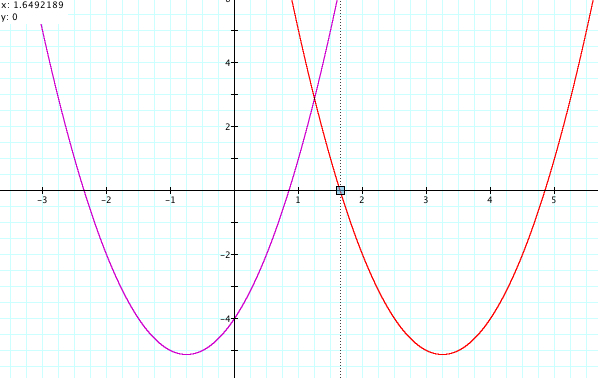
(1) The x-intercept is the point at which the parabola crosses the x-axis. Using Graphing Calculator 3.5, we should trace along the graph and find the point where the y-value equals 0.
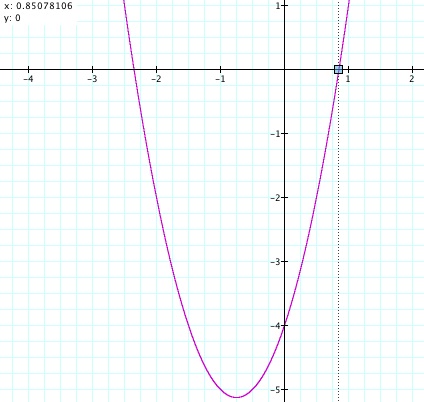
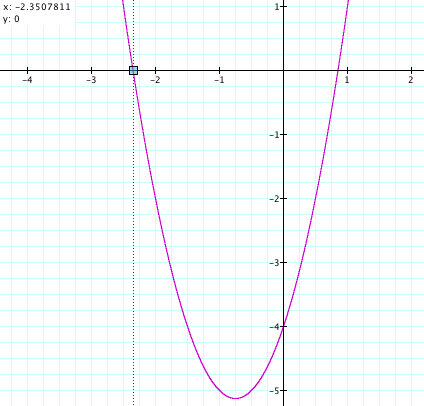
We have two x-intercepts, (0.85078106, 0) and (-2.3507811, 0), of the graph.
(2) The y-intercept is the point at which the parabola crosses the y-axis. Using Graphing Calculator 3.5, we should trace along the graph and find the point where the x-value equals 0.
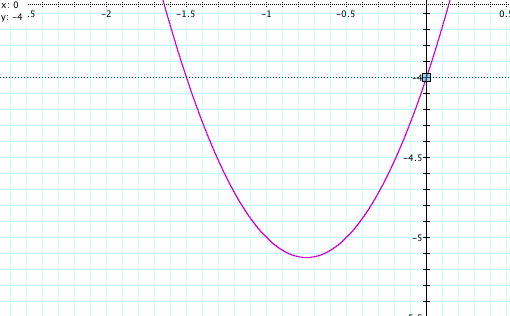
(3) One of important features of a parabola is the vertex which is defined by the highest point or the lowest point of the parabola. If a parabola opens upward, the y-value of the vertex is the minimum value of the function. If a parabola opens downward, the y-value of the vertex is the maximum value.
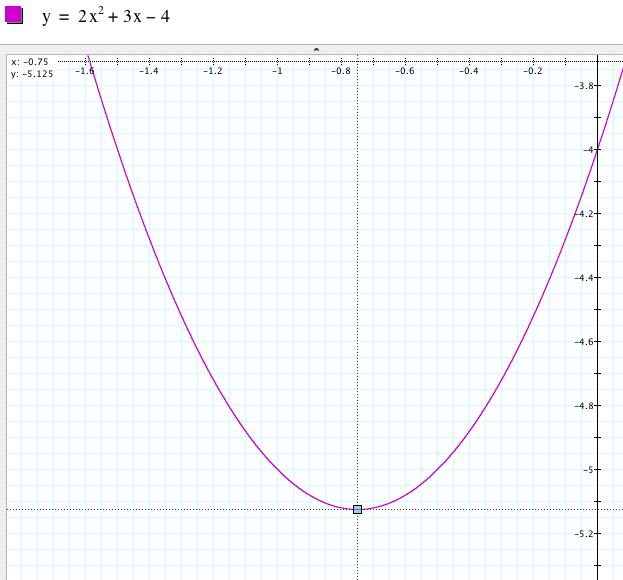
The graph above shows that the vertex of the parabola is (-0.75, -0.5125).
(4) We can easily see that the graph is symmetric with respect to the vertical line x = -0.75 which is called the axis of symmetry.
(I) Now we consider ![]() as
as ![]() .When
we overlay a new graph replacing each (x - 0) by (x -
4),
.When
we overlay a new graph replacing each (x - 0) by (x -
4),
we find that the graph ![]() is
the same as
is
the same as ![]() , except that
, except that
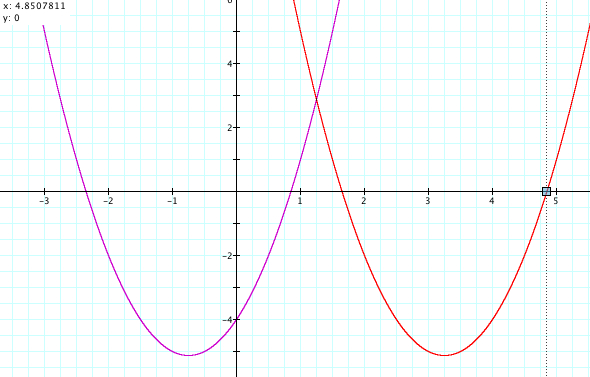
![]() is horizontally shifted to the
right by 4 units along the x-axis. Therefore, the x-intercepts, the x-coordinate
of the vertex, and the axis of symmetry are all shifted to the right by 4
units along the x-axis. Note that there is no change in the y-coordinate of
the vertex. In general,
is horizontally shifted to the
right by 4 units along the x-axis. Therefore, the x-intercepts, the x-coordinate
of the vertex, and the axis of symmetry are all shifted to the right by 4
units along the x-axis. Note that there is no change in the y-coordinate of
the vertex. In general, ![]() is a parabola which horizontally shifted to the right (a > 0) or to the
left (a < 0) by a units along the x-axis from the graph of
is a parabola which horizontally shifted to the right (a > 0) or to the
left (a < 0) by a units along the x-axis from the graph of ![]() .
.
(II) Then how can we change the equation to
move the vertex of the graph into the second quadrant? The points (x, y) consists
of the real values x and y such that x < 0 and y > 0. The keys to the
answer are the vertex of the parabola is (-0.75, -5.125) and translations.
First, using the horizontal shift of the graph along the x-axis, we can make
the x-coordinate of the vertex negative. The x-coordinate
of the vertex of the parabola of ![]() is
0.
is
0.
Therefore the x-coordinate of the vertex of the parabola of ![]() is always negative. The animation below shows an example for -5 < n < 0.75.
is always negative. The animation below shows an example for -5 < n < 0.75.
Second, using the vertical shift of the graph
along the y-axis, we can make the y-coordinate of the vertex positive. The
y-coordinate of the vertex of the parabola ![]() is 0.
is 0.
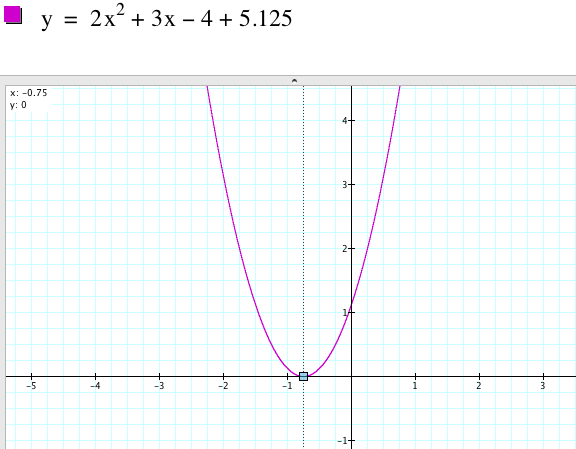
Therefore the x-coordinate of the vertex of the parabola of is ![]() always positive. The animation below shows an example for 5.125 < n < 8.
always positive. The animation below shows an example for 5.125 < n < 8.
To sum up, ![]() for a < 0.75 and b > 5.125 has the vertex of the graph in the second
quadrant.
for a < 0.75 and b > 5.125 has the vertex of the graph in the second
quadrant.
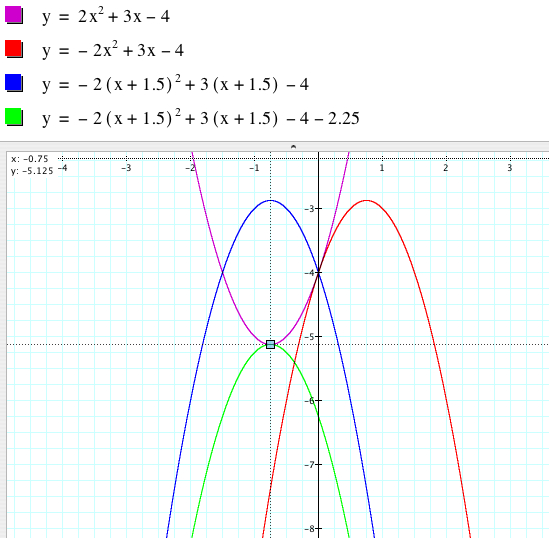
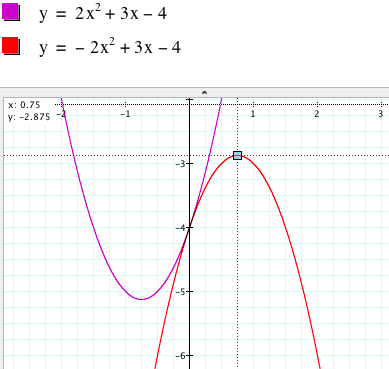
(III) Change the equation to produce a graph concave down that shares the same vertex.
Since the concavity depends
on the sign of the coefficient of ![]() (concave up for positive, negative for concave down), we can try to change
the sign of
(concave up for positive, negative for concave down), we can try to change
the sign of ![]() . However, the vertex
of the parabola
. However, the vertex
of the parabola ![]() is (-0.75, -0.5125)
and the vertex of the parabola
is (-0.75, -0.5125)
and the vertex of the parabola ![]() is
(0.75, -2.875).
is
(0.75, -2.875).
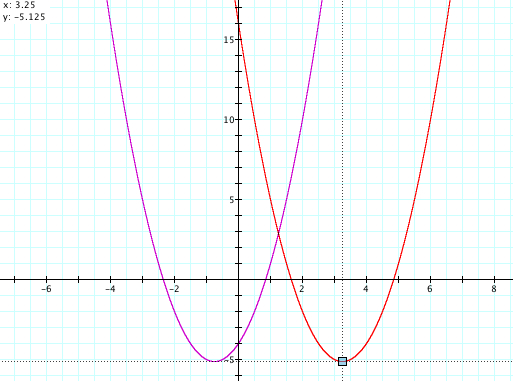
We need to translate the graph of ![]() to
get the same vertex as the one of
to
get the same vertex as the one of ![]() . To
get the x-coordinate of -0.75 from the x-coordinate of 0.75, the graph should
be horizontally shifted to the left by 1.5 units. Therefore
. To
get the x-coordinate of -0.75 from the x-coordinate of 0.75, the graph should
be horizontally shifted to the left by 1.5 units. Therefore ![]() is
the graph which has the same x-coordinate as the x-coordinate of the vertex
of
is
the graph which has the same x-coordinate as the x-coordinate of the vertex
of ![]() .
.
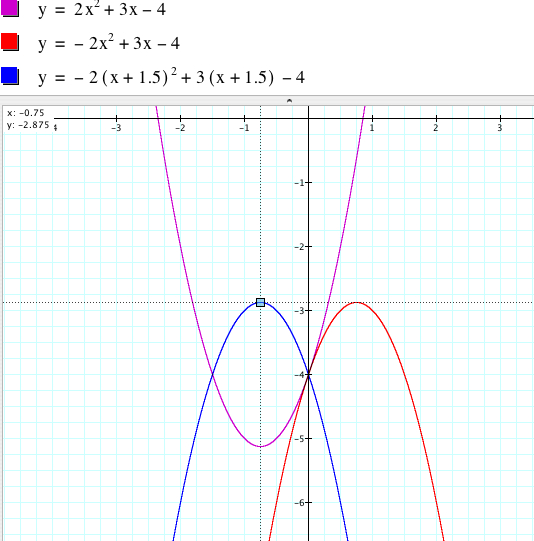
Now we translate the graph of ![]() vertically so that the y-coordinate can be -5.125. In fact, the graph should
be shifted down by 2.25 units which are the difference of the y-coordinates
(5.125 - 2.875= 2.25). Then the graph of
vertically so that the y-coordinate can be -5.125. In fact, the graph should
be shifted down by 2.25 units which are the difference of the y-coordinates
(5.125 - 2.875= 2.25). Then the graph of ![]() has
the same vertex as the graph of
has
the same vertex as the graph of ![]() .
.