
Polar Equations
by
Becky mohl
First, let's investigate the graph:

In Figure 1 below a = 1, b =1, and k =1.
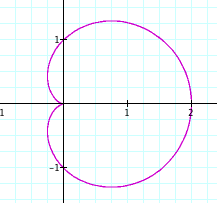

Here we see that the graph has only one pedal of a flower. This is becasue a, b, and k were all 1.
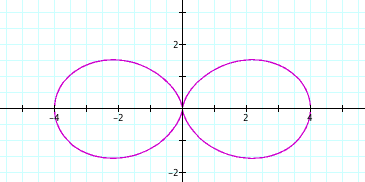
In Figure 2 below, a = 2, b = 2, and k =2. Look this one looks like the infinity sign!!
 .
.
Again the graph has two pedals this time becasause a, b, and k were all 2.
Let's continue to explore.
Figure 3 below has a =7, b = 7, and k = 7 and look it has seven pedals.
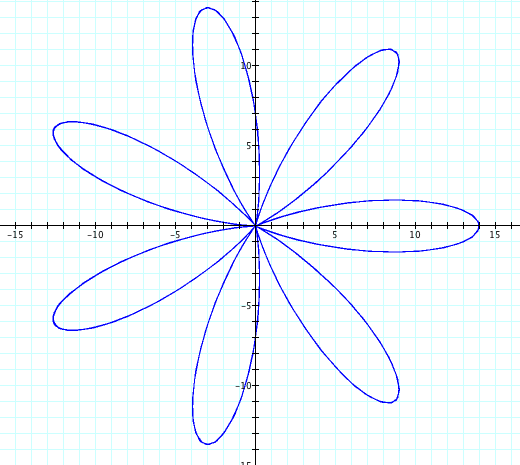

THe graphs seem to be following a pattern. Whatever the values of a, b , and k are equal, the graph shows a number of pedals equal to the variables a, b, and k's numerical value. Now, let's see what happens when the variable are not the same. Let's use the same values we used in the previous graphs. Let a =1, b = 2, and k =7.
Figure 4
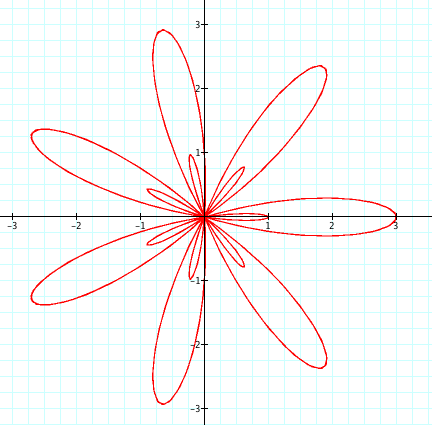

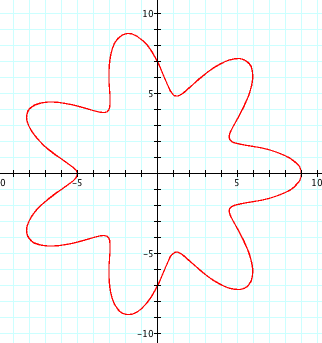
Here the values are: a = 7, b = 2, and k =7. Look this time the pedals bcame fatter.
Figure 5

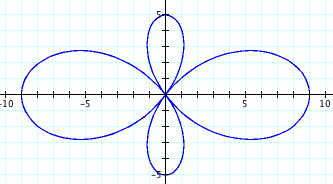
Once more let's make another combination using the same numbers where a = 2, b = 7 and k = 2.
Figure 6

This time let's reverse the order again and see what happens if a = 7, b = 2, and k = 1. Wow, imagine that this time we got a circle! Interesting!
Figure 7


Since the abve picture was so interesting, let's see what happens when we start putting fractins in the equation. a =2 b =2 and k = .75.
Figure 8
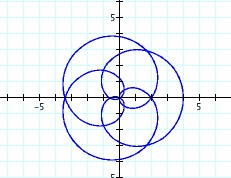

Let's now change a abd b to see how the graph changes.
Figure 9
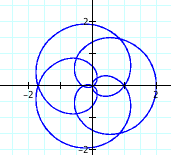

By making a and b smaller, the graph itself became small. Therfore, our assumptions are as followes: k increases the number of pedals made, while a and b make the graph smaller or larger depending on their value. Also, the value of a tells us if there will be a graph inside a graph such as in figure 4.
Now let's really cahnge things up and look at some f the same graphs as above, but change cos() to sin().
Figure 10 uses a =1, b =1, and k =1.


If we compare this graph to the figure 1, when we used cos(), all the graph did was rotate downward 90 degrees.
Let's look at another graph to get an idea as to how the sin() function changes the graph. Here the values are a = 2, b =2, and k = 2.
Figure 11
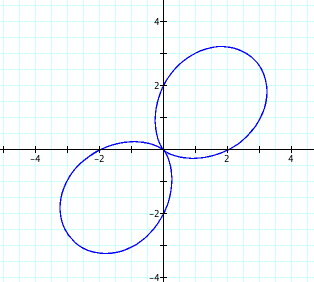

Again compare this to Figure 2, and see that is was also rotated; however, it was not rotated 90 degrees.
This time let's reconstruc Figure 3 using the sine function.
Figure 12
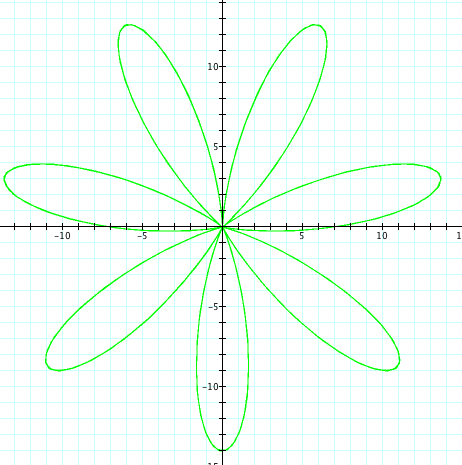

Let's compare one last graph before making our final assumption. Compare this figure with Figure 7.
a = 7, b = 2, ank k =1
Figure 13
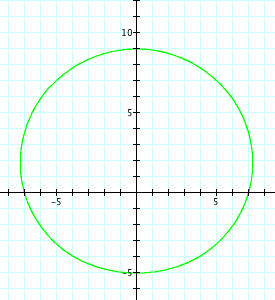
In figure 7 and 13, we see that the both of these equations give us a circle using sin() or cos().
Here nothing change or does it. Figure 13 is rotated; however it appears to be idetical to Figure 3 becaue the graphs are both symmetrical. However, if we look closer, we can tell that the two graphs have different coordinates caused by the equation.
Though these figures, we were able to see how much the graphs could change just by simple transformations such as rotating, stretching, or decreasing the graphs. We can assume for both sin() and cos() that the value of k will tell the number of pedals that the graph will have, and the values of a and b will tell hoe large of small the graphs are along with the a and y coordinates.
Back


 .
.


