Assignment 10
Parametric Curves
Kathy Radford
Assignment 10
Parametric Curves
Kathy Radford
Parametric equations are used when the values of x and y are dependent on the value of a third variable. A common situation is when the values vary with time. This is shown by defining both x and y as functions of t. In this exercise we will experiment with linear functions, and show that we can define the equation of a line by defining both x and y as functions of t, using the “2-Vector” form in Graphing Calculator, which uses the variable t to determine values of x and y.
We will start with the basic functions below, just to see how this works:
x = a + t
y = b + kt
To begin with, let’s set a = 3 and b = 2, and see what the effect of k is, by trying several different values.
It will be necessary to set the range of t to make sure that the values of x and y appear on our graph (around the origin).
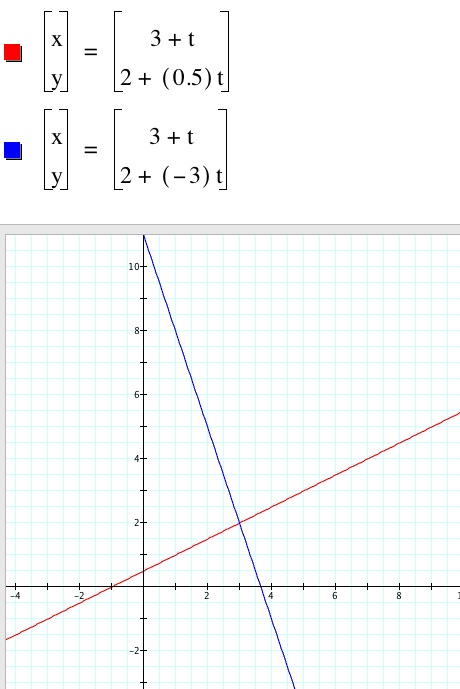
Inspection of the graphs of these equations reveal that the value of k appears to represent the slope of the line, and each line contains the point (a,b).
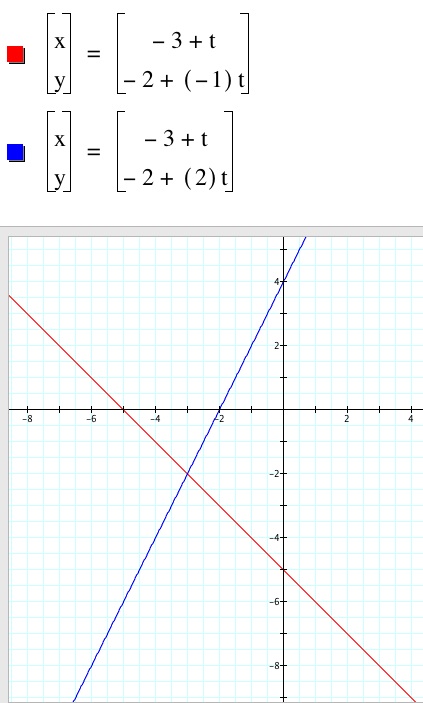
Lets check with different values to make sure:
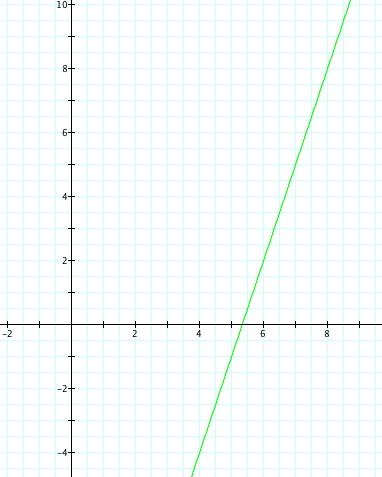
To help understand the graph, let us look at the parametric equations below:
x = t + 1
and
y = 2t – 1
Based on our previous observations, we expect it will have a slope of 2, and contain the point (1,-1):
Which it does.
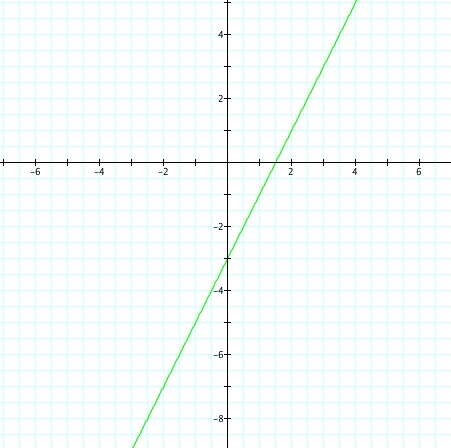
Let’s try to eliminate the variable t from these equations, to get a single equation in x and y.
From the 1st equation, if x = t+1, then t = x-1.
Substituting this into the 2nd equation, we get y = 2(x-1) – 1, and simplifying it becomes
y= 2x -3, a line with a slope of 3, a y-intercept of -3, and yes, containing the point (1,-1).
Finally, based on these observations, we will write the parametric equations of a line segment that contains (7,5) and has a slope of 3.
x = t+7, and y = 3t +5: