First we will consider the graph of y= log x, the logarithm of a number base 10.
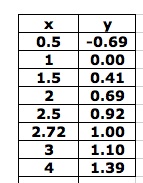
 | We need to consider some specific ordered pairs to understand this graph.

This
function yields the power of 10 that would equal each x value. (The
function values in this table have been rounded to 2 decimal places.)
Since 10 raised to a power cannot be 0 or negative, the domain includes
only positive real numbers. As x gets close to zero, the function
values decrease without bound and as x increases, the values of the
function gradually increase. |
We can see the effect of changing the value of
a in
y = a log x by considering the graphs below:
As the value of
a increases, the function values for x increase more quickly. If
a is negative, the graph is reflected across the x-axis as seen below.
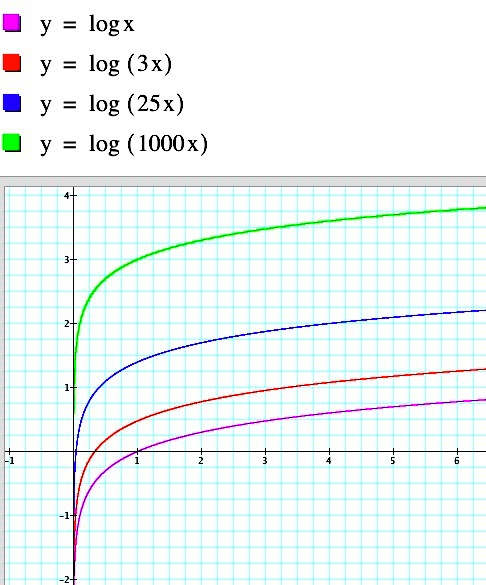
Let's consider what happens when the coefficient of x changes in this equation. Look at the graphs below.
 | It
seems that increasing the coefficient of x has the greatest visible impact on
the graph for x values less than 1. That portion of the graph
seems steeper by comparison while the rest of the graph seems to have
almost the same shape. The change is "concentrated" over a smaller interval. |
When solving problems involving the number
e
it is easier to use logarithms to that base. So, we now consider
all of the variations discussed above with the equation y = ln x, the
logarithm of a number base
e.
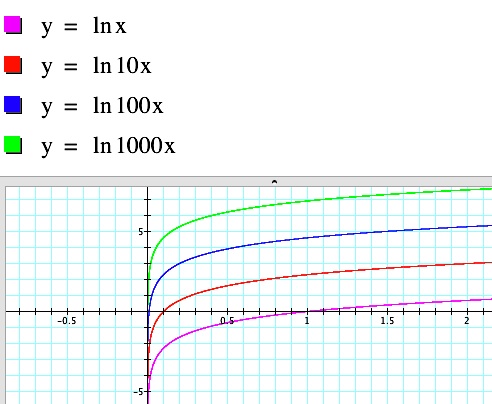
The following graphs show the effect of changing the coefficient of ln x.

| Again we see
that increasing the value of the coefficient of ln x makes the function
increase more rapidly. The green curve is the reflection of the
blue curve over the x-axis. |
We should see that
changing the value of the coefficient of x in this function has the
same result as it did with base 10 logarithms.

| And indeed we do. |
In
summary, we have observed how changing the values of a and b in y = a
log bx and y = a ln bx affects the graph. Although we have noted
some changes, it can be said that the basic shape of the graph remains
unaltered.


