
Exploring
Quadratics
By
Tonya
DeGeorge
In
this investigation, we will be looking at quadratics again, but in a different
way. We will be looking at the
following equation:
![]()
This
graph will show the relationship in the (x,
b) plane.
![]()
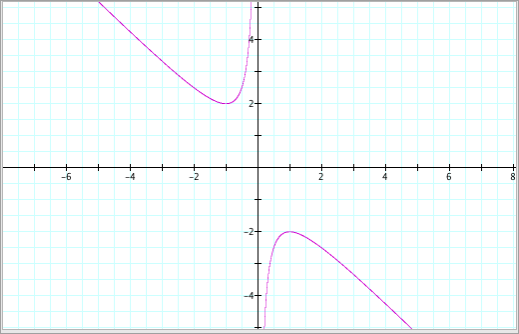
By
adding a horizontal line in the (x, b)
plane, it the intersection of the two graphs corresponds to the roots of the
equation for a particular value of b.
For example, suppose b = 2, we get
the following graph:
If
we were to solve the equation ![]() by
hand, we would find:
by
hand, we would find:

This
corresponds to the graph above because the two graphs intersect at the point
(-1,0) where x = -1. So how can we generalize this for
different values of b? There are a number of cases to
consider:
Case (i): b > 2
Case (ii): b = 2
Case (iii): -2 < b < 2
Case (iv): b = -2
Case (v): b < -2
Let’s
look at these different regions.
We’ve already seen what happens when b
= 2. We found that there
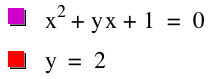
exists one double root: x = -1. For Case (i), where b > 2, lets
choose b = 5. We find the following:

This
implies that the equation has 2 negative roots. Let’s check this by looking at the equation:

Therefore, we see that there
exists 2 negative real roots.
Below
are summaries for the next three cases:
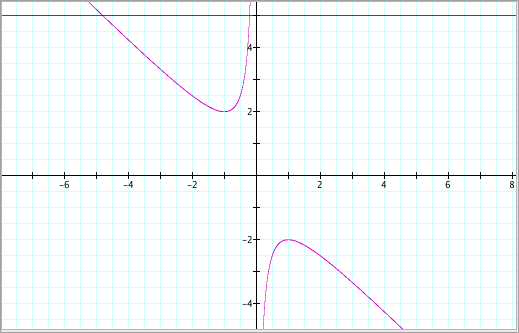
For
Case (iii),
where -2 < b < 2, let’s choose
the value b = 1. We find:

There are two imaginary
roots (hence, the line does not intersect the graph).
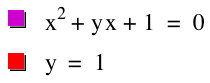
For
Case (iv),
where b = -2, we get:


There is one repeated root
at x = 1 (where the graph intersects
at one point).
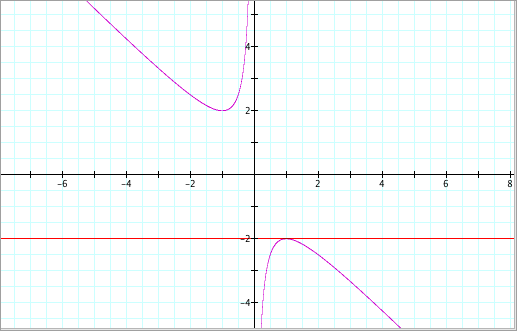
For
Case (v),
where b < -2, let’s choose b = -4. We find:

There exists two positive
real roots.
In
conclusion, we find:
|
Values of b
|
Types of
roots
|
|
b > 2 |
Two negative real roots |
|
b = 2 |
One double root (x = -1) |
|
-2 <
b < 2 |
Imaginary roots |
|
b = -2 |
One double root (x = 1) |
|
b < -2 |
Two positive real roots |
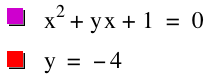
Now
suppose we look at the value of c and
change it to -1 and compare what happens to the graph when this change is done.

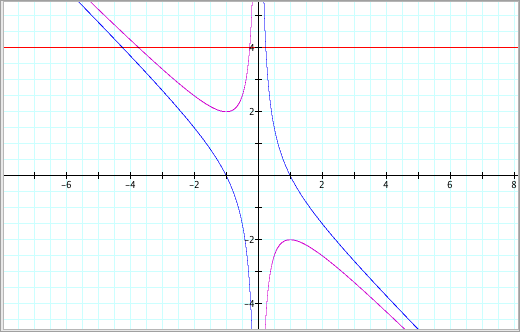
As
we can see, when we change the value of c
to -1, the graph changes into a hyperbola. What happens when we use other values of c?
Let’s use the following values:
c = -2, -1, 0, 1, 2 (all on
the same graph):
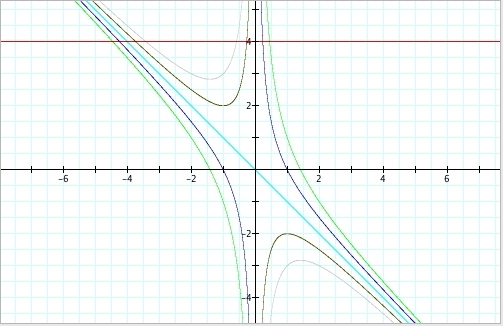
From
here, we can see that the value of c changes
the graph in three different ways.
It could be a hyperbola (two different types) or a line. The three cases seem to be:
Case 1: when c < 0: hyperbola (asymptotic to x = 0 and y = -x)
Case 2: when c = 0: a line (y
= -x)
Case 3: when c > 0: a hyperbola (asymptotic to x = 0 and y = -x)
*Note that the hyperbola is restricted to different
areas of the plane depending on the value of c.