
Exploring the graph of r=c/[acos(kΘ)+bsin(kΘ)].
Below the variables a, b, c, and k are varied.

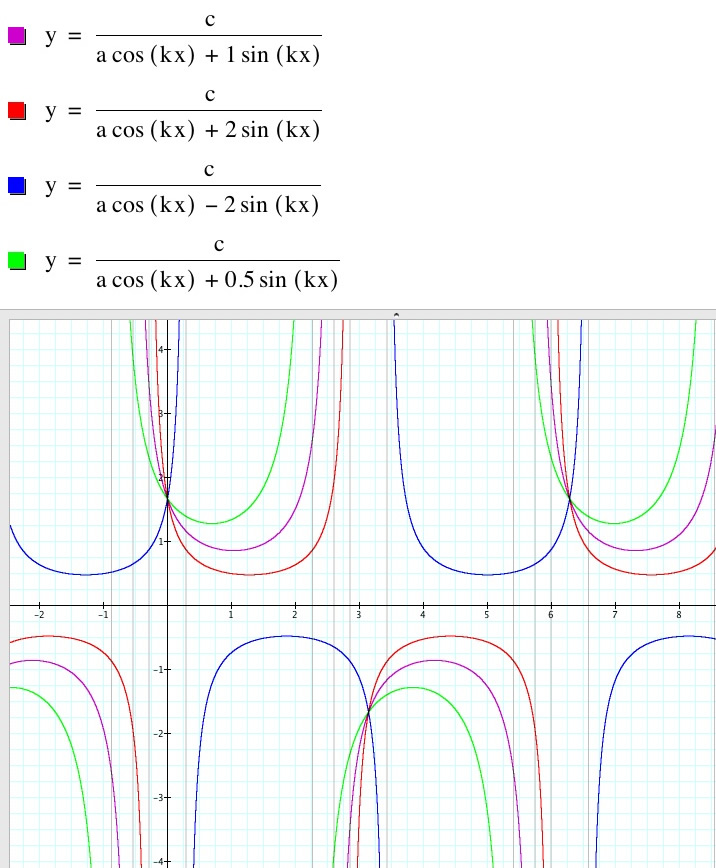
Above a is varied and b, c, and k are all equal to 1.
As a increases, we can see that the vertical asymptotes move shift the graph to the left. When a decreases, and is negative, the vertical asymptotes move and shift the graph to the right.

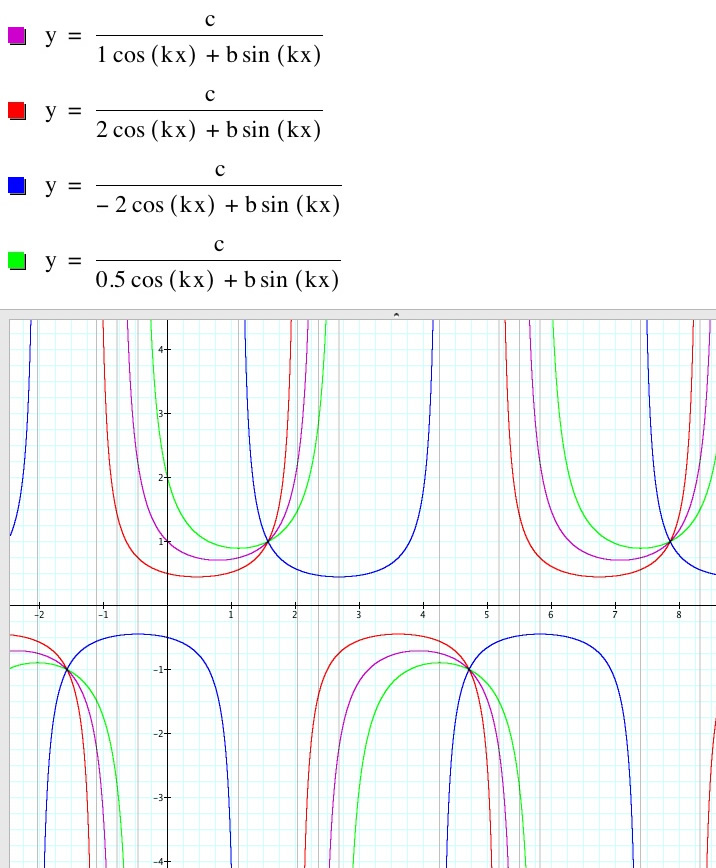
Above b is varied and a, c, and k are all equal to 1.
As b increases, we can see that the vertical asymptotes move shift the graph to the right. When a decreases, and is negative, the vertical asymptotes move and shift the graph to the left.

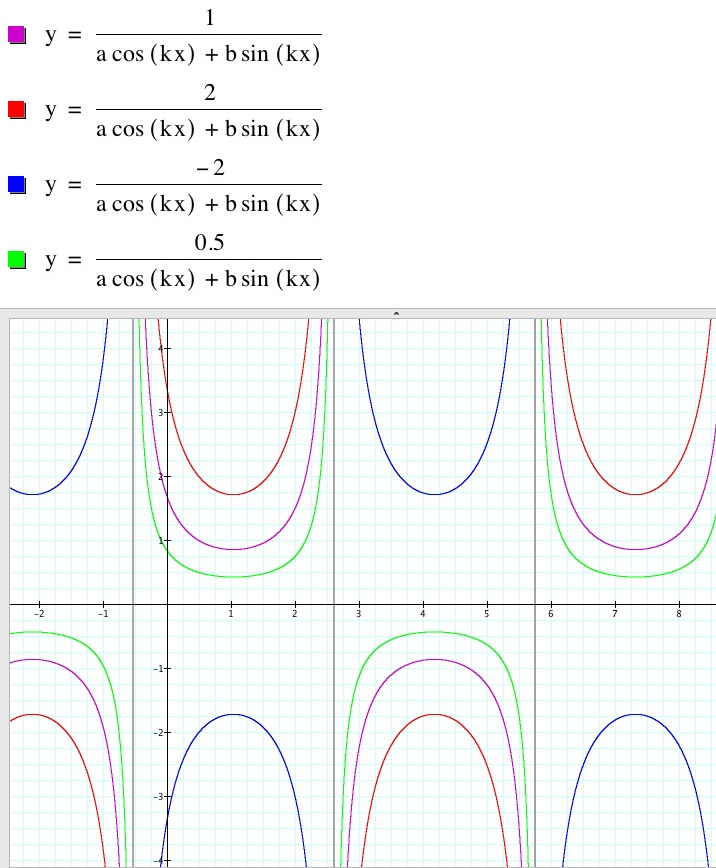
Above c is varied and a, b, and k are all equal to 1.
As c decreases, the graph approaches the x-axis. Hence the greater the value of c, the further the base of the graph is from the x-axis. When c is negative, the graph is flipped over the x-axis to mirror its positive counterpart.

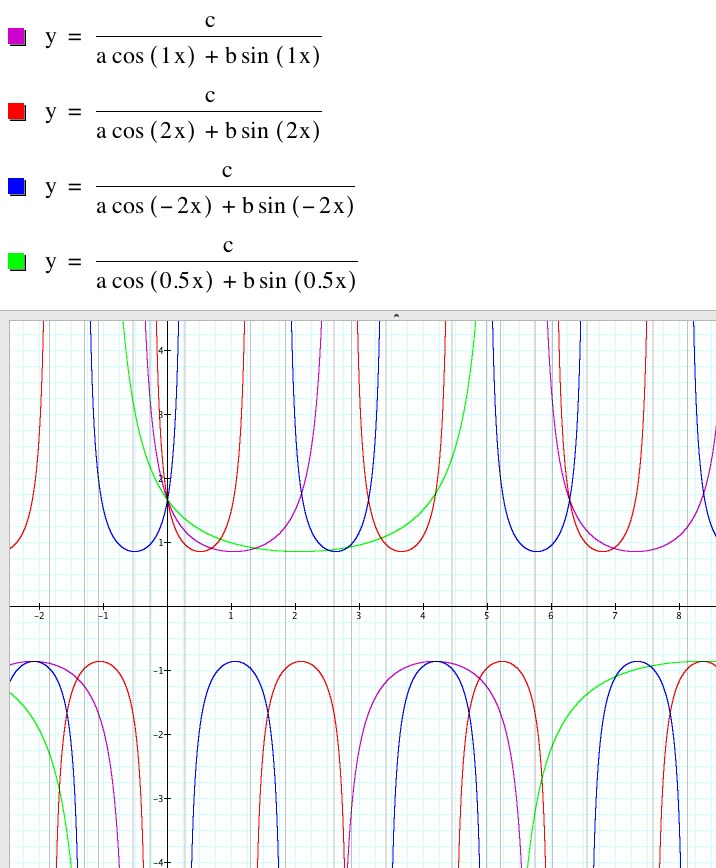
Above k is varied and a, b, and c are all equal to 1.
As k decreases, the graph’s period is enlarged. Hence, the smaller the value of k, the larger the period of the graph. When k is negative, the graph of its positive counterpart is reflected across the y-axis.
To return to exploring the graph of r=asin(kΘ)+b click here.