Fifth Degree Equation
By
Jane Yun
In early nineteenth century, Ruffini and Abel showed
that the equations of the fifth degree could not be solved with radicals. The general quinitic is thus not like
general quadratic, cubic, or biquadratic. Nevertheless, it presents a problem
in algebra, which theoretically can be solved by algebraic operations. Only, these operations are so hard that
they cannot be expressed by the symbols of radicals.
In
this exploration, we will explore the following equation by changing the values
of Ōa
Õ, investigate the shape of graph for
different values of Ōa Õ, and look for relationships. Using a
Graphing Calculator, we will start the exploration of
x5 = (x2 - y2)(x2 – ay2)
First, by inspecting the equation, I came into the conclusion that when x =
0, y = 0, and when y=0, x =1.
Hence, IÕm predicting that the intercepts of the graph are the points
(0, 0) and (1, 0) and the shape of graph will change as Ōa Õ changes.

Notice that as Ōa Ō
changes from 0 to 10, the intercepts of graph are at points (0,0) and (1, 0), and a graph of
equation is symmetric with respect to x-axis. Also notice the change in the shape and the domain of the graph when a
= 0, a = 1, a =
3, a = 5, & a = 10, but the range of graph is not changing. Ths range is
(-°, °).
When
a = 0, the negative x-coordinate side shows the continuously stretching loops, and the positive x-coordinate side shows that the loop gets wider as 'a' decreases to 0.
In the negative x-coordinate side, the graph shows two stretched loops. The loop stretches longer and the width of loop gets smaller
in the positive x-coordinate side as ŌaÕ increases.

LetÕs
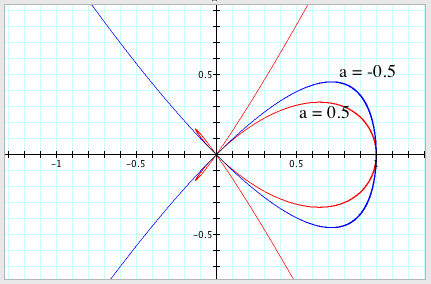
try when a = -1.
The shape of graph
changed to more like a HersheyÕs Chocolate, but the
intercepts of graph are at points (0, 0) and (1, 0) and the domain of graph is (°, 1].

Then,
letÕs investigate when a = -3, a = -5, and a = -10. Notice the change in the shape of graph. The shape of graph changes as 'a' decreases, but the intercept points do not change. Also the domain changes as 'a' changes, and the graph is symmetric with respect to the x-axis. Also notice that the graph starts to show a heart shape when a = -1, and the shape of heart stretches as 'a' decreases but till keeping the same intercept points.

LetÕs
look when we put all the graphs together.

Based
on the results from the graphs, we can draw few conclusions about the graph of x5 = (x2 - y2)(x2 –
ay2). The intercepts are at points (0, 0) & (0, 1), and the
original equation is always symmetric with respect to the x-axis.
The animation is shown below when 'a' changes from -10 to 10.