William Plummer - Assignment #1
Examine the following formula:
![]()
and its graph:

When the 4 in the equation is replaced by other numbers, the shape of
the graph changes

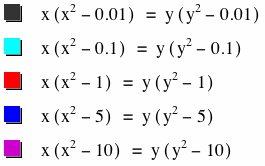
The above substitutions for 4 resulted in the following graphs:

As n changes, the graph consistently intersects the y axix at 1, 0, and -1
In the graph below, press the play button to see how the graph changes
as n changes.
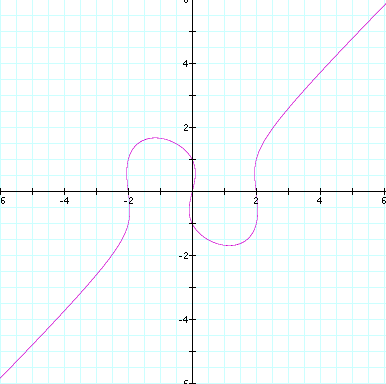
As n increases, the curve in the second
and fourth quadrants expand and the graph intersects the x axis at:
![]()
As n decreases, the curve in the second and fourth quadrants shrink
until n equals the subtrahend in the second set of parenthesis.
![]()
In this case the subtrahend is 1.
As n continues to decrease past the second subtrahend, the graph
changes again into an “S” shape that continually becomes thinner, still
intersecting the y-axis at 1, 0, and -1.
When both subtrahends are equal to some number n, the graph takes on
the shape of an ellipse bisected by the line y = x.


Larger equivalent subtrahends result in larger ellipses intersecting
both x and y axes at:
![]()
Decreasing equivalent subtrahends result in ellipses that decrease in
size until n=0. When n ≤ 0, the ellipse disappears and the remaining graph is
the line y = x.
After exploring the original equation, the following graph is given

The graph above corresponds to the following equation:

When a constant is added to one side of the equation, the shape of the
graph changes.

Here we added seven integers from -3 to 3. The resulting graph is
below:

Finally we look at the following equation:
![]()
This is a three dimensional equation that yields the following graph:

From looking at the three dimensional equation, we can see what happens
when we vary the x-variable: