
Assignment 1:
Examining the Graph of y= a sin(bx+c)
In this assigment we will explore the graphs of
y = a sin(bx+c).
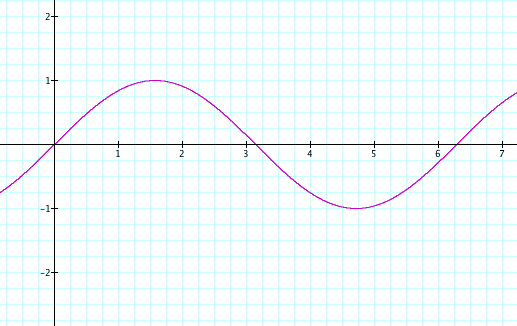
First let us examine the graph of y = sinx. Becoming familiar with this graph will allow us to observe any changes that occur as we explore what happens when we change the values of a, b, and c.
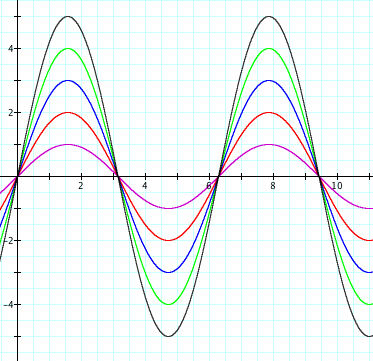
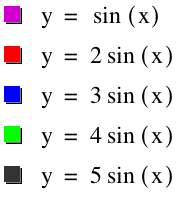
Now let's examin the changes that occur associated with the value of a. What happens when a = 1, 2, 3, 4, 5. You will notice that as the value of a goes between 1 and 5, the graph stretches vertically, each time changing the minimum and maximum value of y = a sinx.
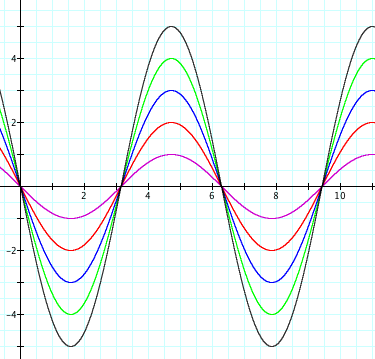
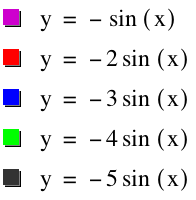
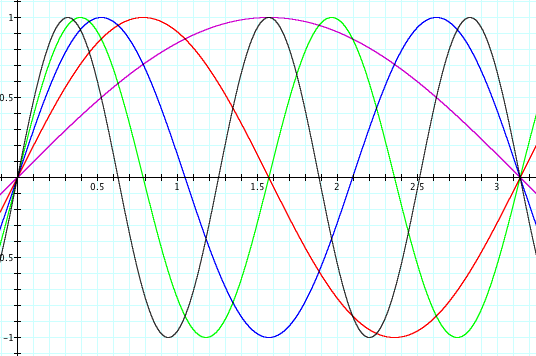
What happens when a is a negative number? Allow a = -1, -2, -3, -4, -5. Notice that the graph is still stretched, but this time is reflected over the x-axis.
Click here to see a video of this change in a.
Now let's examine changes that occur with the parameter b. What happens when b = 1, 2, 3, 4, 5? Notice that as b increases the period of y = sinbx shrinks. That is to say, notice how the graph from 0 to π repeats itself more times in that range as b increases.
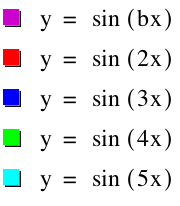
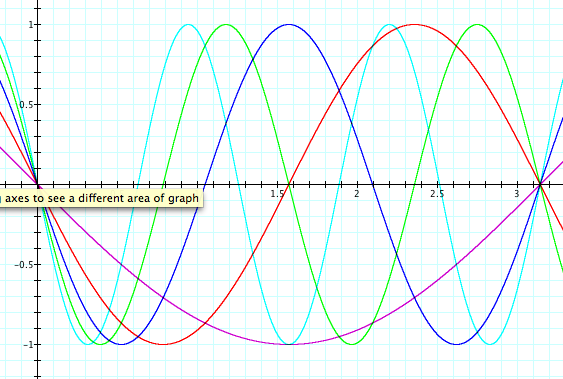
What happens when b is negative? Allow b = -1, -2, -3, -4, -5. Notice that the period still increases, however, the graph is reflected over the y-axis.
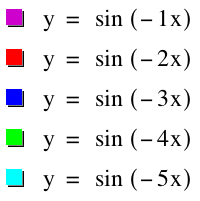
Click here to see a video of this change in b.
Finally let's examine changes that accompany the parameter c. What happens when c = 1, 2, 3, 4? Notice that the graph of y=sin(x+c) shift left 1, 2, 3, 4 units correspondingly.
x.gif)
.gif)
Let's also examine what happens when c= -1, -2, -3, -4. Notice then that the graph shifts to the right.
.gif)
.gif)
Click here to see a video of this change in c.