

Consider the rational equation  .
.
We want to see the effects that varying a, b, c, and d has on the graph.
We will start by varying a. Let's set b = 3, c = 1, and d = 1. Then we will vary a to values of -5,-3, -1, 0, 3, and 5. Take a look at the graph below.
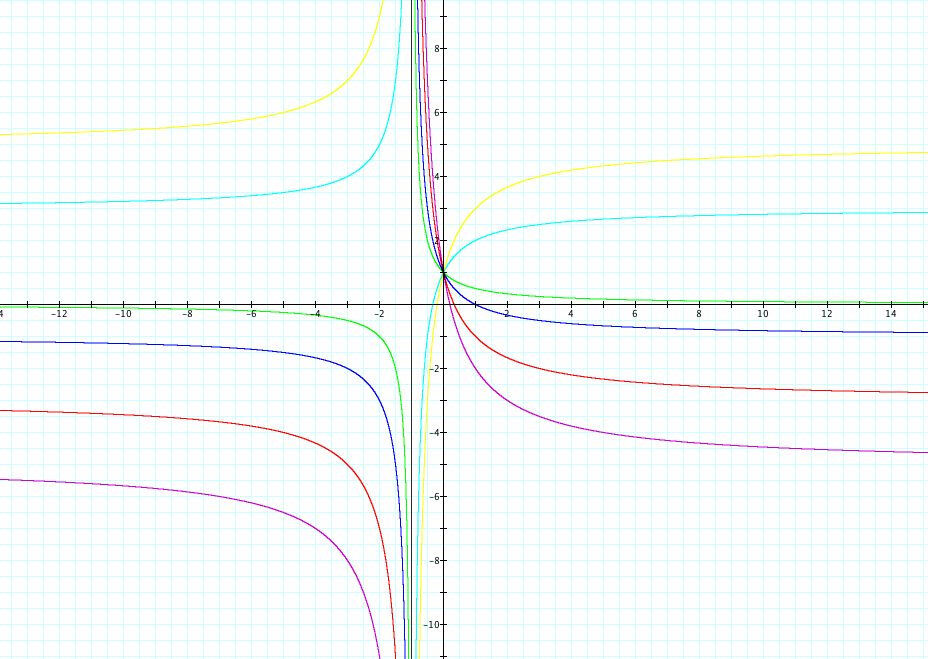
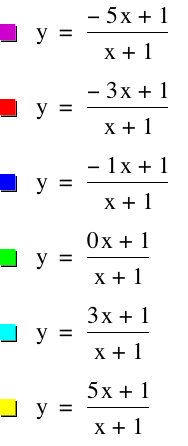
We notice several things about the graph above. The first is that all of the graphs share a vertical asymptote at x = -1. This is because the denominator must not equal 0, so x ≠ -1.
The next thing we notice is that each graph has a y- intercept at y =1. If we set x = 0, then it will show the y-intercept. In this case it will be 1/1=1.
Each graph has a vertical asymptote, but they do not share the same one. This asymptote is found by calculating a/c.
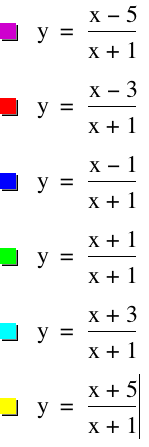
Now we will vary b. We will let a = c = d = 1. We will let b = -5, -3. -1, 1, 3, and 5. Take a look at the graph below.
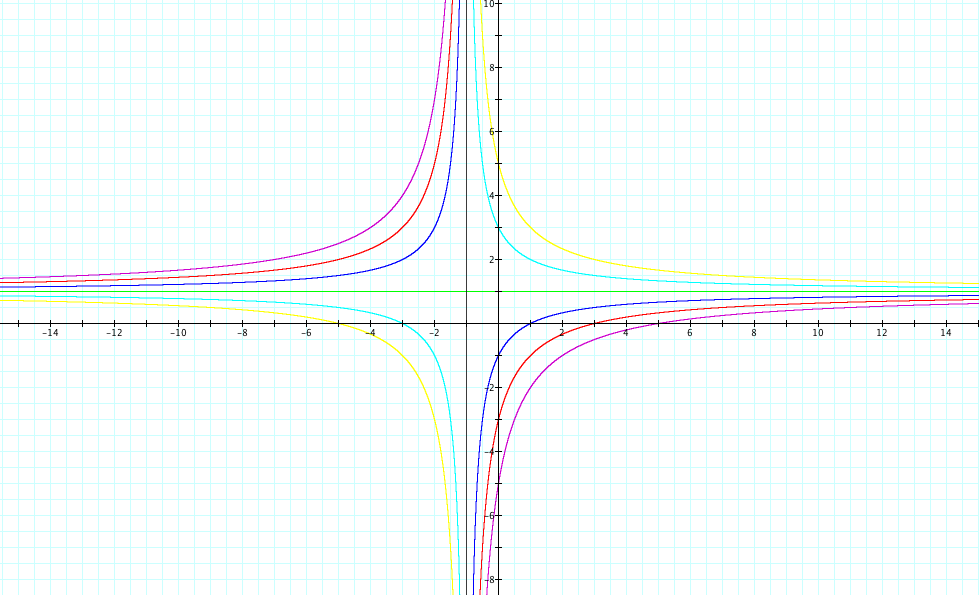
Notice that again every graph has a vertical asymptote at x=-1. This is for the same restriction that exists on the denominator.
All graphs have the same horizontal asymptote, which comes from a/c = 1/1 =1.
Each graph has a different x-intercept. The x-intercept can be found by setting the numerator equal to 0 and solving for x.
The functions also have different y-intercepts. These can be found by substituting x=0 into the expression.
Also the green graph is a horizontal line. Notice that this is because the equations divide out and leave the function as a constant.
The last thing to notice is that the purple, red, and blue graphs are increasing, while the yellow and light blue graphs are decreasing. Why is that?
We know that it will be constant when ax+b is divisible by cx+d. This is only true when a/c = b/d, or when ad = bc. From this, we can see that when ad > bc, the function is increasing, and when ad < bc, the function is decreasing.
Now we will vary c. We will let a = b = d = 1. We will let c = -5, -3, -1, 0, 3, and 5.
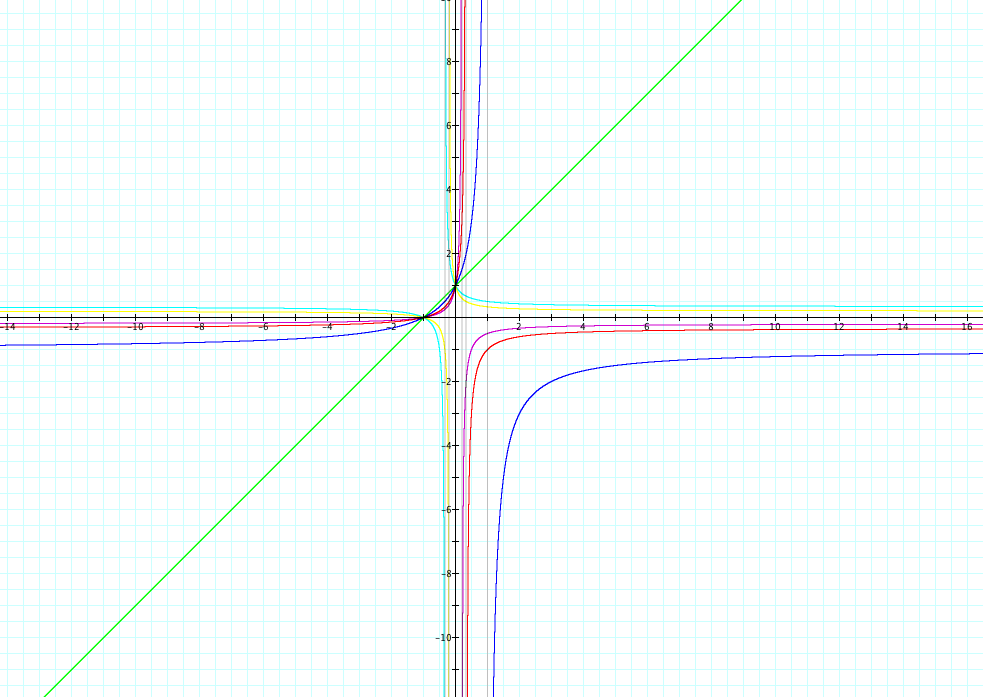
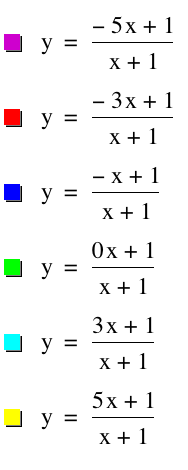
First, we notice that when c = 0, then the equation is a straight line. This is not surprising, when we see that c=0 yields y=x+1.
The next thing we notice is that the vertical asymptotes are not the same. To find the vertical asymptote, we must simply set cx+d=0. Then x=-d/c will be our vertical asymptote.
Our observations about x-intercepts and y-intercepts are the same.
Finally, we will vary d. Let a = b = c = 1. We will let d = -5, -3, -1, 0, 3, 5.
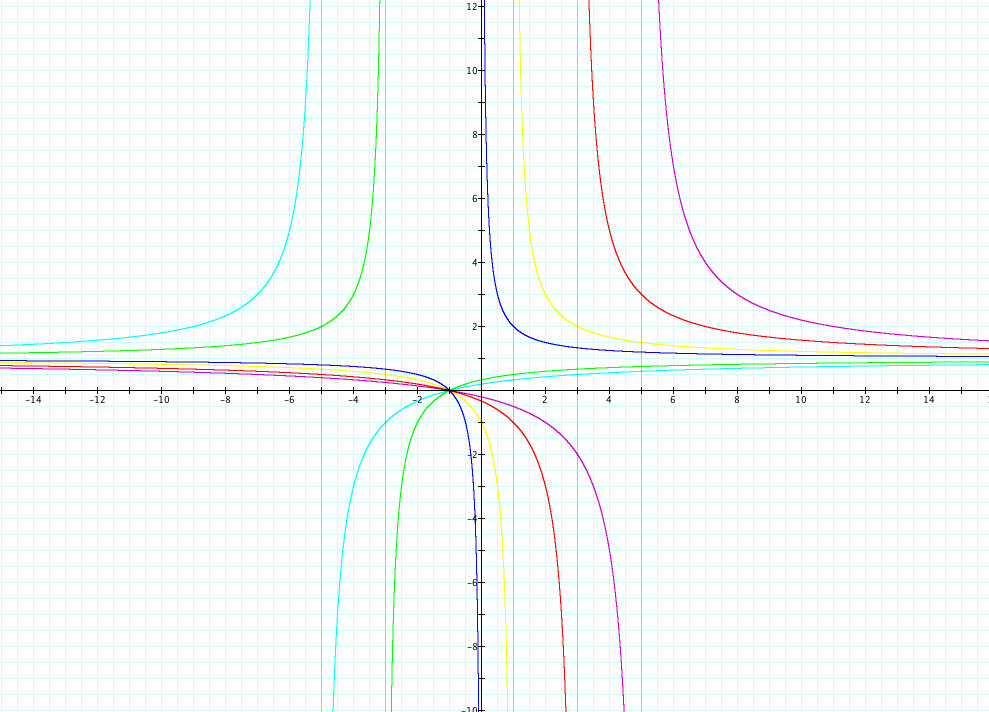
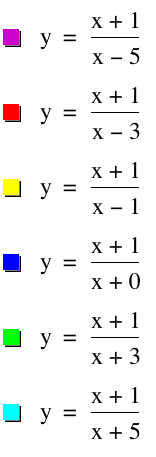
Again, we can see that the vertical asymptotes are found by setting the denominator equal to 0.
Horizontal asymptotes are still a/c.
The observations about x- and y-intercepts remains the same.
Also, our earlier observation about increasing and decreasing functions is the same.
1) The vertical asymptote can be found by setting the denominator equal to 0 and solving for x.
2) Horizontal asymptotes can be found by solving a/c.
3) Y-intercepts are found by setting x = 0.
4) X-intercepts can be found by setting the numerator equal to 0.
5) If ad > bc, the function is increasing. If ad < bc, the function is decreasing. If ad = bc, the function is constant.
Now we want to generalize what we found to the equation  , where f(x) and g(x) are polynomials.
1) It still holds that setting the denominator equal to 0, will allow us to find the vertical asymptote(s) of the graph.
2) The horizontal asymptote is found by :
If the degree of f(x) > g(x), then no horizontal asymptote exists.
If the degree of f(x) = the degree of g(x), the horizontal asymptote is y = a/c.
If the degree of f(x) < g(x), then the horizontal asymptote is y = 0.
3) X-intercepts are found by setting the numerator equal to 0 and solving for x.
4) Y- intercepts are found by plugging x = 0 into the equation.