Final Project
By:
Jonathan Sabo
Lets observe what happens as we set the values of A,B,C, and D.
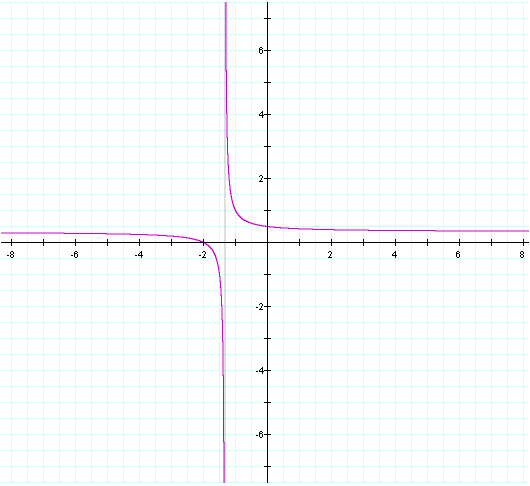
First we will let A =1, B = 2, B = 3, and D = 4.
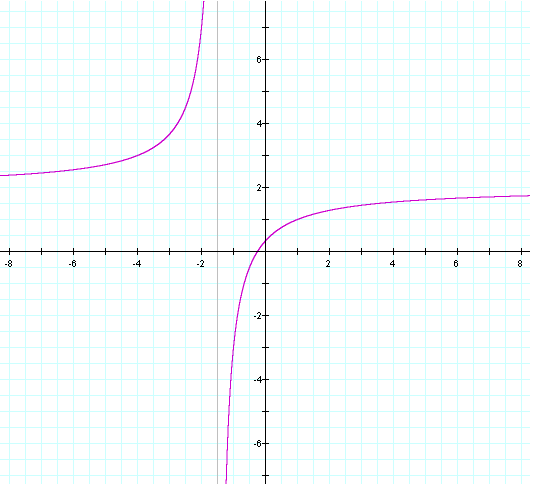
Now let A = 4, B = 1, C = 2, and D = 3
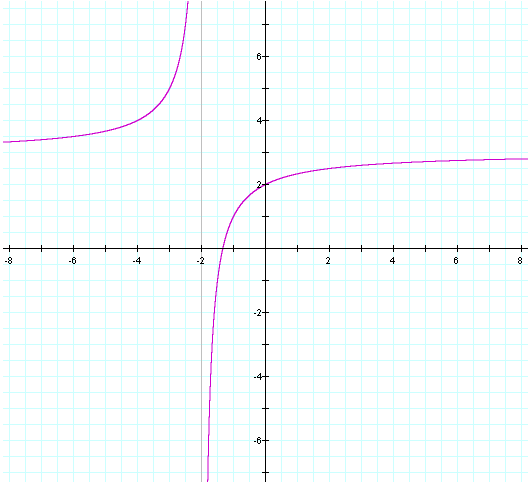
Now let A = 3, B = 4, C = 1, and D = 2
Now let A = 2, B = 3, C = 4, and D = 1
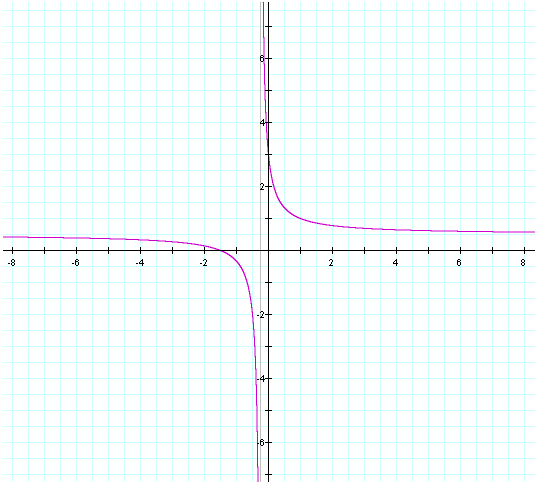
From looking at the picture we notice that when ad - bc is greater than zero, the graph is higher on the left side and lower on the right side. We also notice when ad - bc is less than zero, the graph is lower on the left side and higher on the right side.
Now lets observe what happens when A = B = C = D = 1,
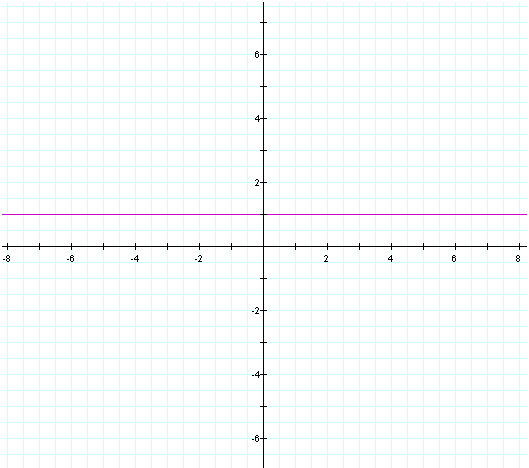
We notice when ad - bc = 0, the graph will form a horizontal line.
2.
In order to construct this we need to first construct a square with side lengths s. After constructing the square we need to construct the midpoint of any segment of the square. This midpoint needs to be connected to eiter of the opposite vertices of the square. Now using this midpoint and segment we can construct a circle by center and radius. Observe that this circle goes through 2 of the verticees of the square. Now both of the segments labeled a can be constructed. In order to construct the semicircle I constructed an arch through 3 points.
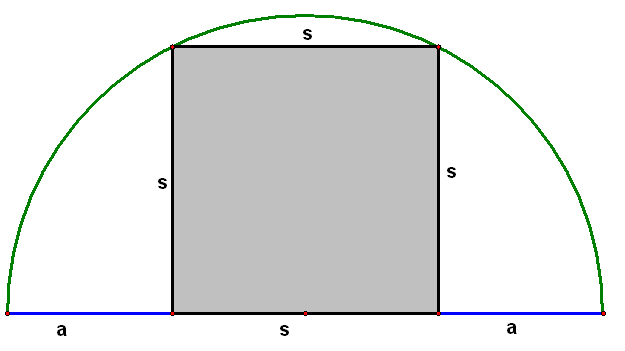
Now in order to find the ratio of s/a, we will re construct the segment from the midpoint of segment s to one of the opposite verticees. Observe,
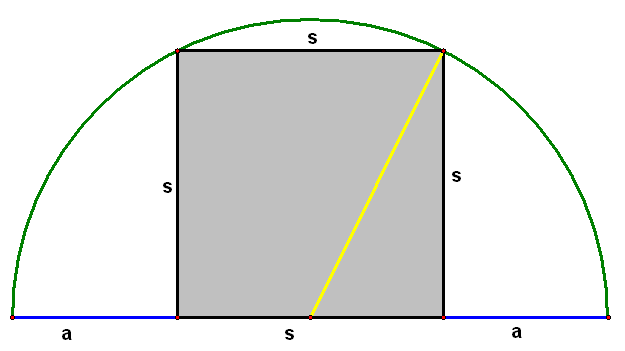
This segment is equal to the length of
 .
This is true because both of these segments are the radius of the
square. Now since the yellow segment is equal to we can solve for the yellow segment and this will help us solve for s/a. Observe,
.
This is true because both of these segments are the radius of the
square. Now since the yellow segment is equal to we can solve for the yellow segment and this will help us solve for s/a. Observe,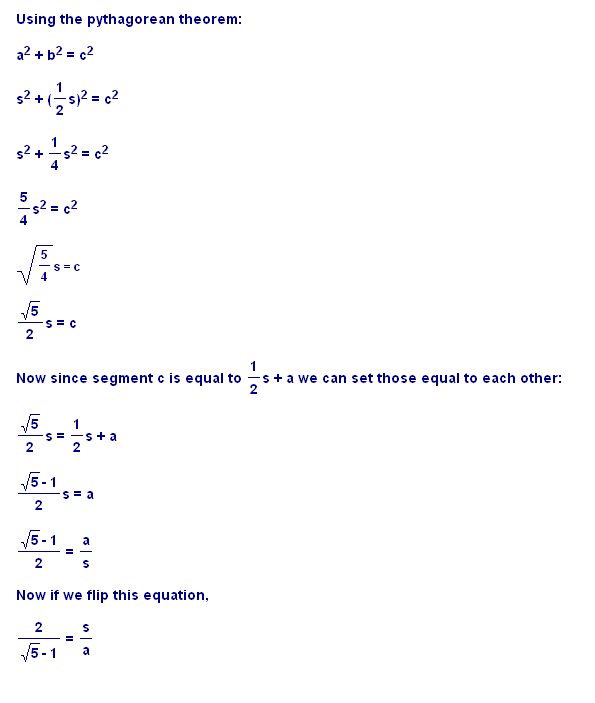
We see that this ratio is the same as the Golden Ratio.
3.
Select one additional item from the assignments or from explorations presented in class that you have not written up. Submit a write-up about it.
Produce several ( 5 to 10) graphs of
on the same axes using different values for d and f. Does varying d change the shape of the graph? the position? Does varying f change the shape or position of the graph?
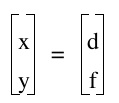
Plot the points (d, f) on your graphs using
This is the GC 3.5 "2-vector" input and is essentially a parametric equation for a point.
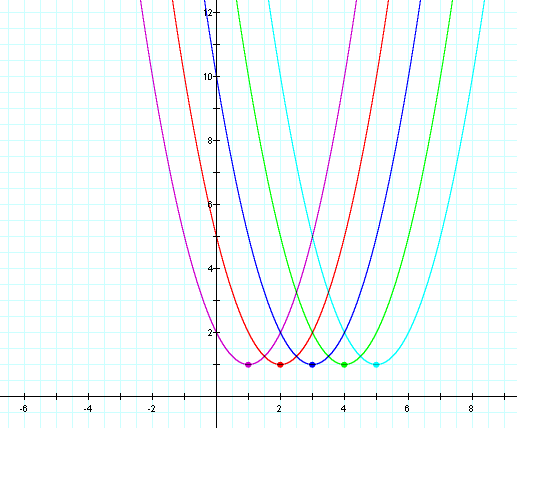
First we will graph five different functions where we vary d.
Observe,
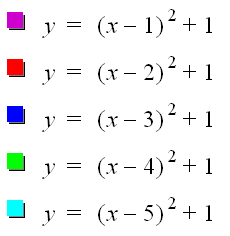
We can see that as d changes the function shifts horizontally.
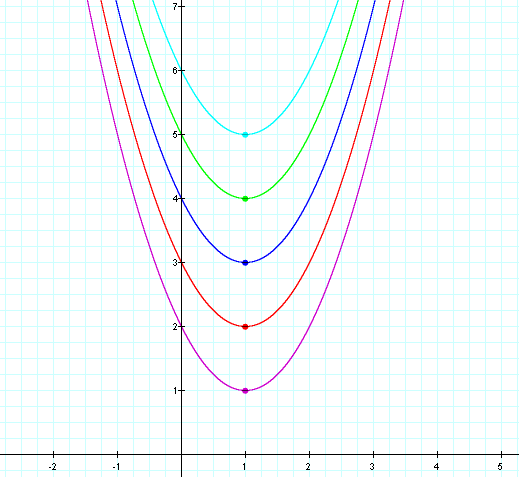
Now lets vary f and see what happens,
We can see that as f increases the function will shift vertically.
From these graphs we can see that as d increases the function will shift vertically. As f increases we can see that the function will shift vertically. In both of these cases the shape of the graph does not change. We can also see that whatever the the d value is will be the x coordinate of the function and whatever teh f value is will be the y coordinate of the function.
Return to Home Page