by: Doris Santarone
Assignment #2: The effects of a, b, and c on ![]()
Our goal is to observe the graph of the quadratic ![]() with different values of a, b, and c. We hope to see some sort of pattern that gives insight into the meaning of each of the constants.
with different values of a, b, and c. We hope to see some sort of pattern that gives insight into the meaning of each of the constants.
First, let's start with the most basic quadratic ![]() (where a = 1, b = 0, and c = 0).
(where a = 1, b = 0, and c = 0).

Some Observations:
1) The parabola has a vertex at the origin.
2) The parabola is concave up.
3) The parabola is symmetric to the y-axis.
Let's observe the effects of the graph when a is changed. We will specifically look at a=5, 3, 1, 0.5, -1, and -4. (We will keep b = 0 and c = 0 for all of these graphs.)


Some similarities of the graphs:
1) All of the graphs have a vertex at the origin.
2) All of the graphs are symmetric to the y-axis.
Some differences of the graphs:
1) Concavity: All of the graphs where a>0 are concave up, and the graphs where a<0 are concave down.
2) The "width" of the graph varies. As ![]() increases, the "width" of the parabola decreases (the graphs gets "skinnier"). What is the reason for this? Well...the a value is being multiplied times the y-coordinate of the original graph. When multiplying by large numbers, the y-coordinates are getting larger, causing the graph to increase more quickly.
increases, the "width" of the parabola decreases (the graphs gets "skinnier"). What is the reason for this? Well...the a value is being multiplied times the y-coordinate of the original graph. When multiplying by large numbers, the y-coordinates are getting larger, causing the graph to increase more quickly.
3) The graphs of ![]() and
and ![]() are the same width, but
are the same width, but ![]() is concave up and
is concave up and ![]() is concave down. In other words, they are reflections of each other across the x-axis. Is this true for all quadratics whose a's are negatives of each other? Let's see...
is concave down. In other words, they are reflections of each other across the x-axis. Is this true for all quadratics whose a's are negatives of each other? Let's see...


Yes. Quadratics with negative a's (and equal b's and equal c's) are reflections of each other across the x-axis.
Now, let's observe different values of c. We'll use c = 4, 3, 2, 1, -1, and -2. (We will keep a = 1 and b = 0).


Some similarities of the graph:
1) All of the parabolas are concave up.
2) All of the parabolas are symmetric to the y-axis.
3) All of the parabolas have the same "width". (If you could pick up one of the graphs and lay it over top of the others, you would see that they are all the same "width.")
Difference of the graph:
1) The vertex is different. All of the parabolas have a vertex with 0 as the x-coordinate (the vertex is on the y-axis), but have different y-coordinates. The y-coordinate of the vertex is c. In other words, the graph has been shifted vertically by c units.
Finally, let's look at the effects of the graph when changing the constant b. Let's use b = 7, 4, 2, 1, -1, and -3. (We will keep a = 1 and c = 0).


Some similarities of the graphs:
1) All of the graphs are concave up.
2) All of the graphs are the same "width."
3) All of the graphs pass through the origin.
Difference of the graphs:
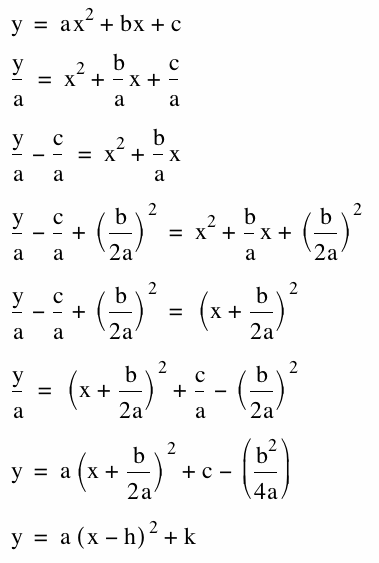
1) The vertex is different. The graph appears to be shifted horizontally AND vertically. I can see that the x-coordinate of the vertex is -b/2. To better understand how to find the shifts, I will change the general form of the quadratic into the vertex form:


If the vertex is (h, k), then h tells us the horizontal shift and k tells us the vertical shift.
Back to Homepage