by: Doris Santarone
Trigonometric Functions
In a previous lesson, we found the definition of the 3 trigonometric functions to be:

In order to extend the definition of the trig functions to angle measures beyond ![]() =
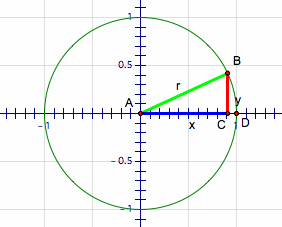
= ![]() radians (or 90 degrees), we need to take the right triangles to the coordinate plane. Suppose you were plotting a point (x,y). I will call this point B. The method that you would use is to start at the origin, then move left or right by the specified x, then move up or down by the specified y. If you trace these steps, you will form a right angle on the x-axis. Then, finish the right triangle by drawing in the radius that is formed from the origin to point B. See an example below:
radians (or 90 degrees), we need to take the right triangles to the coordinate plane. Suppose you were plotting a point (x,y). I will call this point B. The method that you would use is to start at the origin, then move left or right by the specified x, then move up or down by the specified y. If you trace these steps, you will form a right angle on the x-axis. Then, finish the right triangle by drawing in the radius that is formed from the origin to point B. See an example below:

Using the definitions from above, we can restate the trigonometric functions as:
Further, if we are working on the unit circle (circle of radius 1), then r = 1, and
Thus, the coordinates of point B can be expressed as ![]()
Geometer's Sketchpad Activity
Now, we will use GSP to explore the graphs of the trigonometric functions. Click here for the activity handout.
Below are examples of the sketches that students will create in the activity above:
Extension: The graphs of the reciprocal functions can also be graphed using the same process. Below are examples of the graphs of the Cosecant, Secant, and Cotangent Functions. (NOTE: After making observations about the graphs of the cosecant, secant, and cotangent functions, press the "Show/Hide" button in the sketch to see the graph of the function, along with the graph of its reciprocal function. Make comparisons and contrasts between these graphs.)
Application
After making some observations about the graph of the sine and cosine functions, we can apply them to real world phenomena. This Powerpoint will lead you through some terms needed to discuss these graphs and some applications of the graph. Also, at the end of the Powerpoint, there is a link to a video of this application being taught in a high school classroom. This video is for pre-service and/or in-service teachers to see how they might incorporate the graph of the sine function into their classroom. The video also gives teachers a chance to see some of the obstacles that might occur and how they would confront or avoid those obstacles. Click here for a link to the video (link is also in the Powerpoint.)